September 25, 2024 | 6 min read
Continuation funds have grown exponentially over the last five years as flexible solutions for general partners (GPs) to generate liquidity for their limited partners (LPs) and raise additional capital from new investors to grow their portfolio companies. Broader adoption by both GPs and LPs demonstrates that these transactions are not simply a temporary response to a challenging market for traditional private equity exits. Rather, they have become a flexible portfolio liquidity tool with staying power and tremendous room for growth that is enabling GPs to extend their exposure to the strongest performing assets in their portfolios.
Now, the data has finally arrived with academics and practitioners alike confirming the merits of this burgeoning asset class and its potential for new investors to access private equity-like returns with a lower risk profile. This data is adding credence to continuation transactions and helping cement their place in the GP and LP toolkit.
Continuation funds growing at a breakneck pace
More than three quarters (80%) of the top 100 GPs have already accessed the continuation market,1 illustrating the growing adoption continuation funds are experiencing. Looking at market data, single-asset continuation vehicles (SACVs) within GP-led secondaries have grown from less than 10% of the GP-led market in 2018 to as much as half of the market in the last three years.2 In aggregate, the volume of SACVs between 2021-2023 totaled $70 billion, 3.3x the previous three years ($21 billion from 2018–2020).3 Notably, in the first half of 2024, continuation funds represented 86% of GP-led transactions with SACVs making up the majority of the deals (55%), followed by multi-asset continuation vehicles with 31%.4
H1 2024 breakdown of GP-led transactions
No Data Found
Source: Evercore, H1 2024 Secondary Market Survey, July 2024. “Other” is comprised of preferred equity which represented 9% of transactions and tender offers which represented 5%.
The research is catching up to market trends
The data is beginning to corroborate the asymmetric risk/return opportunities associated with continuation transactions versus traditional buyouts, as a growing body of research spanning academia, consultants, and market participants confirms that continuation vehicles offer the potential for outsized risk-adjusted returns in the form of private equity upside with lower downside risk. Based on our experience, this stands to reason. Sources of continuation vehicle alpha include (i) positive selection bias of high performing portfolio companies by private equity sponsors, (ii) mitigated change-of-control or blind pool risk, and (iii) transaction structures that look to optimize GP and LP alignment.
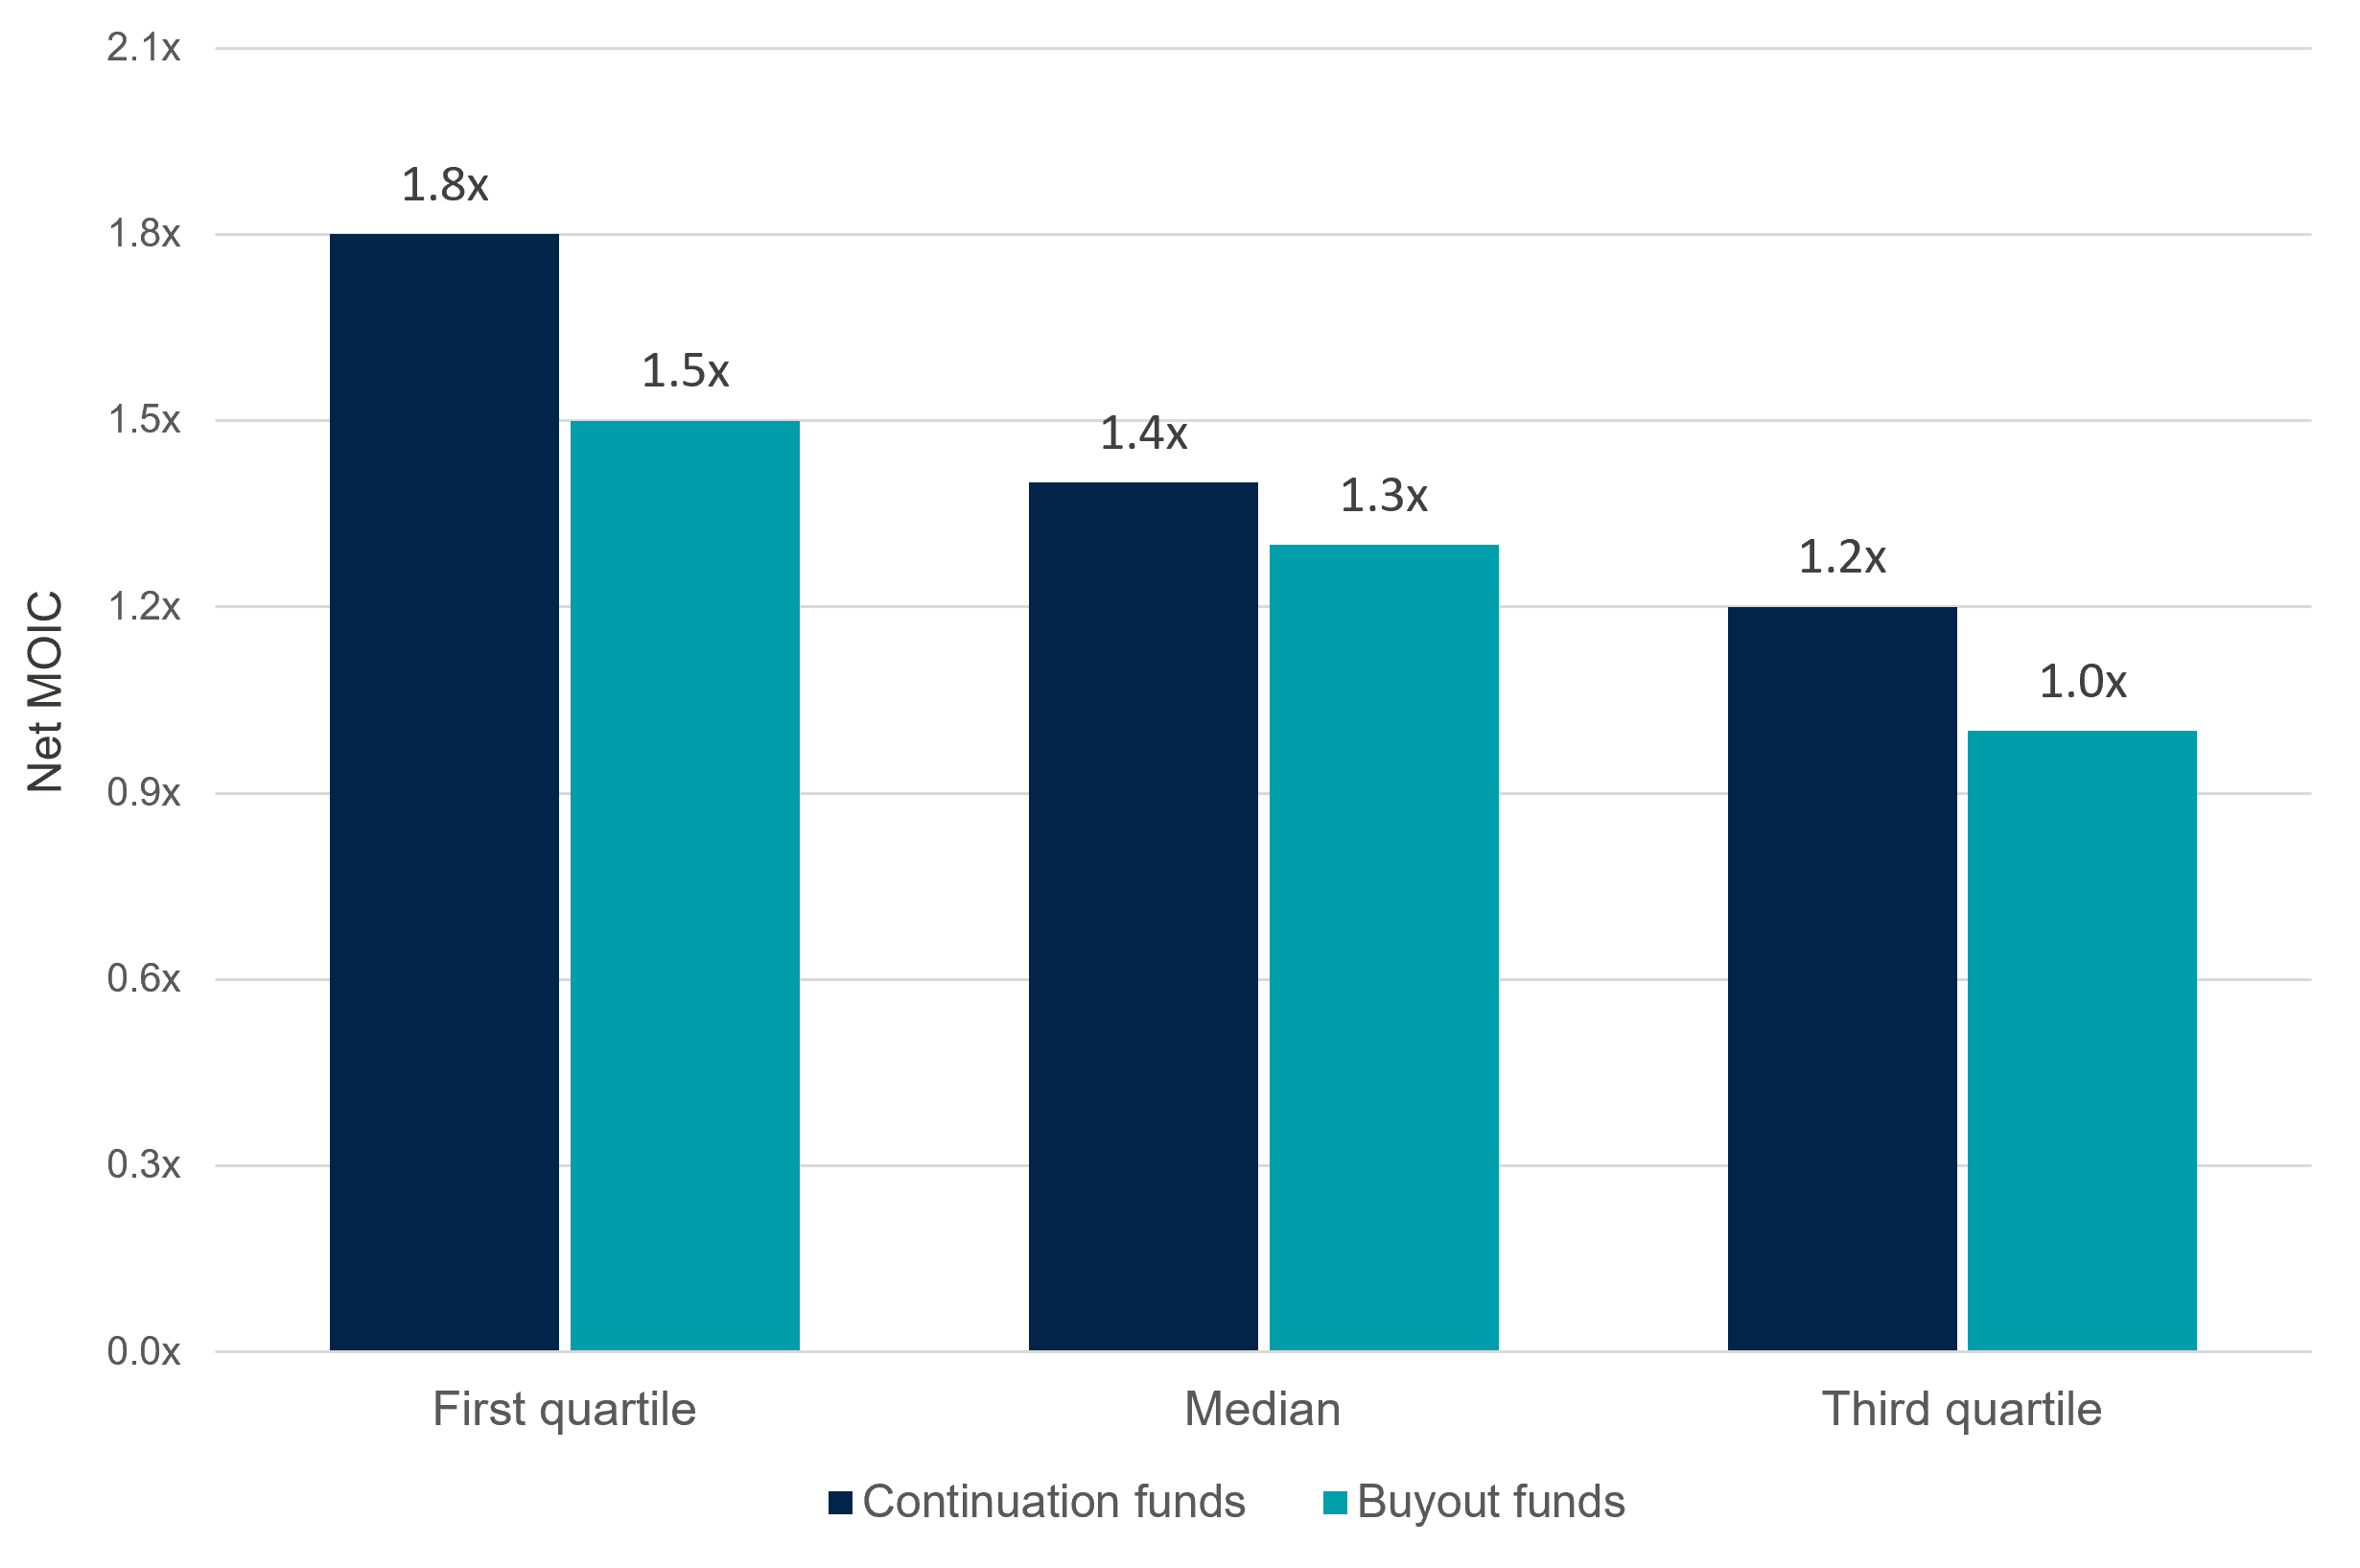
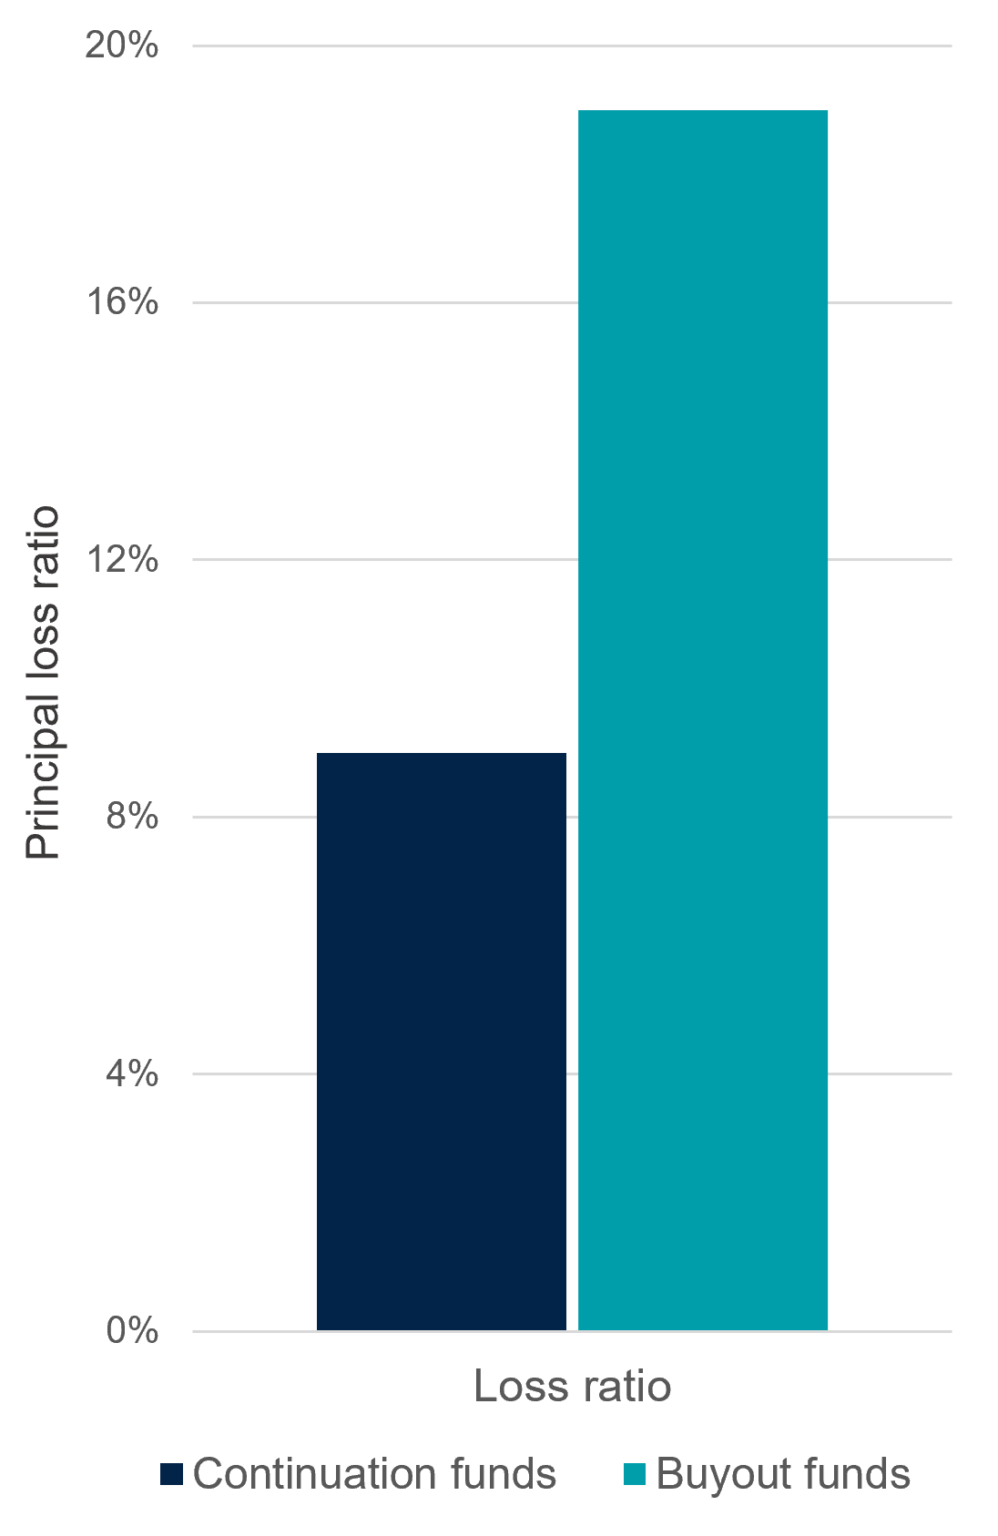
Based on the last five years of publicly available data, research shows continuation funds outperform buyout funds in each quartile — but with less than half the risk (9% loss ratio for continuation funds versus 19% for buyouts).6
Continuation fund performance vs. buyouts (vintage years 2018-2023)
Source: Morgan Stanley Private Capital Advisory, The Case for Continuation Funds: An Initial Performance Review, August 2024. Past performance is not a reliable indicator of future results.
In a study from March 2024, “Continuation Funds” Performance and Determinants, 2018–2022 Vintages, the HEC School of Management, Paris, also examined the performance of continuation funds versus buyout funds. Similar to the above, the HEC study found that continuation funds performed in-line with vintage-matched buyout funds (1.50x mean TVPI for continuation funds versus 1.51x for buyouts), but with more balanced and consistent returns than traditional buyouts (Gini co-efficient of 0.32 for continuation funds versus 0.46 for buyouts).7 Put another way, relative to buyouts, continuation funds offer the potential to generate comparable absolute returns with lower volatility.8
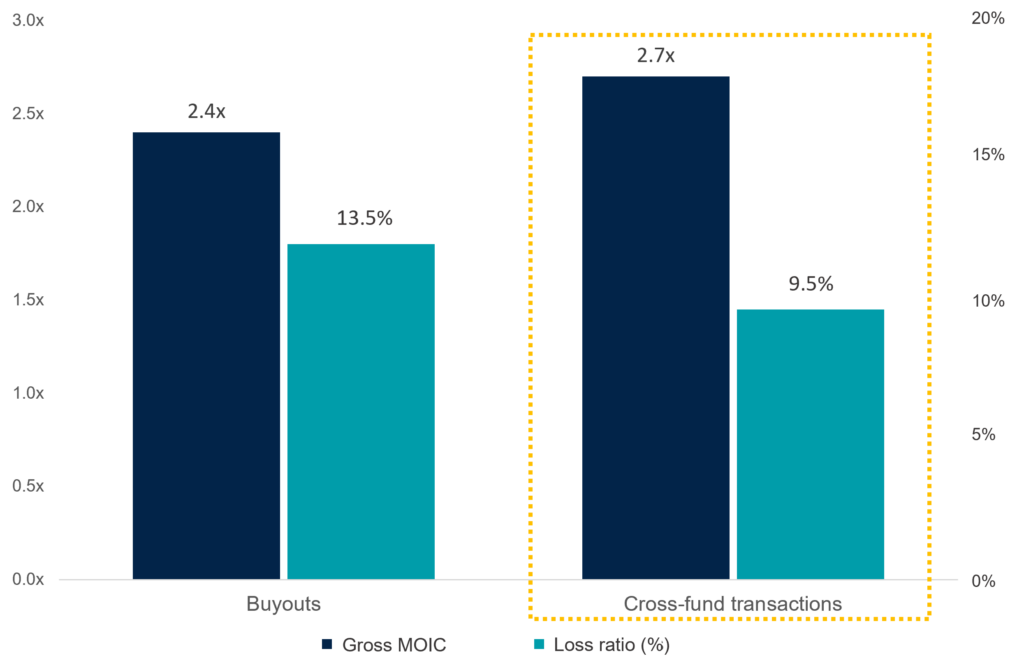
The above research is an exciting development marking some of the first market-level analysis relating to continuation solutions. Importantly, it provides third-party confirmation of our intuition as well as trends that we have observed in HarbourVest data. For example, HarbourVest’s Quantitative Investment Science (QIS) team explored the continuation market from the perspective of cross-fund transactions, which involve transferring an asset from a sponsor’s older vintage fund to a newer vintage. These transactions are similar to the GP-led continuation vehicles in the secondary market today, which involve the transfer of an asset to a special purpose vehicle by the original sponsor rather than a newer vintage fund. Looking at data from January 1, 2008-March 31, 2024, cross-fund transactions outperformed traditional buyouts on a multiple basis by 0.3x (2.7x versus 2.4x), but with 30% less risk (9.5% loss ratio versus 13.5% for buyouts).9
Comparing MOIC and loss ratios: buyouts vs. cross-fund transactions
Source: HarbourVest, internal investment research data as of March 31, 2024. For illustrative purposes only. Past performance is not a reliable indicator of future results. Investors and prospective investors should bear in mind that the data presented is based on historical information and, as such, should not be construed as predicting future investment performance of the HarbourVest fund. Additionally, this does not represent the actual experience of any investor or any HarbourVest fund. Market conditions have a strong impact on investments and realizations and could materially change these results. This information should be used solely as a guide and should not be relied upon to manage your investments or make investment decisions. Dataset is dollar-weighted based on partnership investment and fully realized investments in 3,448 buyout funds and 49 cross-fund transactions from January 1, 2008–March 31, 2024. Fully Realized Investments defined as investments where Realized Value = Total Value. Gross MOIC defined as Gross Multiple on Invested Capital (includes realized and unrealized values). Loss Ratio defined as aggregate realized and unrealized losses divided by total invested capital.
A maturing landscape for continuation funds with staying power
In addition to research from market practitioners and academia, consultants are also noting the strong tailwinds behind continuation solutions. For example, as GPs and LPs search for liquidity, recent research by Bain & Company10 highlights a growing appreciation by stakeholders that the standard 10-year commingled fund structure does not always align with the natural lifecycle for private equity ownership or positive business cycles. Continuation vehicles are providing a structural alternative, and a fourth “exit” strategy alongside IPOs and sales to strategic and financial buyers. And SACVs, particularly, allow GPs to extend the value creation runway on their most prized assets while providing important liquidity levers and flexibility to underlying LPs, along with the potential opportunity for competitive private equity returns with a lower risk profile.
The same report also highlights a large and aging overhang of unrealized private equity assets ($3.2 trillion or ~28,000 companies) of which 40% is four years or older.11 As these investments continue aging, continuation solutions provide GPs a flexible alternative to traditional exits that will fuel a supply of high-quality deals into the future. Coupled with the state of the secondary market, which is currently undercapitalized, that sets the stage for a potentially significant alpha opportunity for investors executing on continuation transactions.
Despite the positive trends and growing adoption of continuation solutions, the market is still maturing, and LPs and asset allocators continue to face the question of how best to position their portfolios. While existing secondary or buyout commitments typically offer modest exposure to these assets, there is also a growing number of LPs committing to dedicated strategies focused on continuation solutions as part of their secondary or buyout portfolios.
Key takeaways: Why now for continuation funds?
In the last several years, continuation solutions have truly achieved “proof of concept,” reaching critical mass in terms of the volume of transactions and market acceptance. With greater awareness and appeal building around these transactions, there is increased investor interest in fund offerings dedicated to continuation solutions — another signal that these vehicles are here to stay and increasingly cementing an important place in the toolkits of GPs and LPs.
- As GPs balance the dual challenges of their LPs’ need for liquidity with the sponsors’ desire to hold onto their prized assets for longer, continuation transactions, and particularly SACVs, have become more widely adopted. GPs and LPs alike value the strategy as a means of extending the runway on high-quality assets that offer asymmetric risk/return opportunities, while new investors value the opportunity to access the potential alpha these transactions can potentially provide.
- On the performance front, independent research specific to continuation funds is now confirming HarbourVest data and intuition. Continuation transactions and their highly calibrated assets provide the potential for meaningful risk-adjusted alpha in the form of private equity upside with considerably lower downside risk relative to traditional buyouts.
- The current supply/demand dynamics are positive for investors, with the volume of high-quality, investible opportunities exceeding the supply of capital to invest, which has created a buyer’s market in continuation transactions for the foreseeable future.
Would you like to discuss continuation solutions?
- Morgan Stanley Private Capital Advisory, H1’24 Investor Survey, August 2024.
- Evercore, 2023 Secondary Market Survey Results, February 2024, and Evercore, 2022 Secondary Market Survey Results, February 2023.
- Evercore, H1 2024 Secondary Market Survey, July 2024.
- Evercore, 2023 Secondary Market Survey Results, February 2024, and Evercore, 2022 Secondary Market Survey Results, February 2023.
- Morgan Stanley Private Capital Advisory, The Case for Continuation Funds: An Initial Performance Review, August 2024.
- “Continuation Funds” Performance and Determinants 2018-2022 Vintages, Oliver Gottschlag, PhD, HEC School of Management, March 2024.
- HarbourVest internal investment research data as of March 31, 2024. For illustrative purposes only. Past performance is not a reliable indicator of future results. Investors and prospective investors should bear in mind that the data presented is based on historical information and, as such, should not be construed as predicting future investment performance of the HarbourVest fund. Additionally, this does not represent the actual experience of any investor or any HarbourVest fund. Market conditions have a strong impact on investments and realizations and could materially change these results. This information should be used solely as a guide and should not be relied upon to manage your investments or make investment decisions. Dataset is dollar-weighted based on partnership investment and fully realized investments in 3,448 buyout funds and 49 cross-fund transactions from January 1, 2008–March 31, 2024. Fully Realized Investments defined as investments where Realized Value = Total Value. Gross MOIC defined as Gross Multiple on Invested Capital (includes realized and unrealized values). Loss Ratio defined as aggregate realized and unrealized losses divided by total invested capital.
- Bain & Company, Global Private Equity Report 2024.
HarbourVest Partners, LLC is a registered investment adviser under the Investment Advisers Act of 1940. This material is solely for informational purposes and should not be viewed as a current or past recommendation or an offer to sell or the solicitation to buy securities or adopt any investment strategy. The opinions expressed herein represent the current, good faith views of the author(s) at the time of publication, are not definitive investment advice, and should not be relied upon as such. This material has been developed internally and/or obtained from sources believed to be reliable; however, HarbourVest does not guarantee the accuracy, adequacy, or completeness of such information. There is no assurance that any events or projections will occur, and outcomes may be significantly different than the opinions shown here. This information, including any projections concerning financial market performance, is based on current market conditions, which will fluctuate and may be superseded by subsequent market events or for other reasons. The information contained herein must be kept strictly confidential and may not be reproduced or redistributed in any format without the express written approval of HarbourVest.
Nothing herein should be construed as a solicitation, offer, recommendation, representation of suitability, legal advice, tax advice, or endorsement of any security or investment and should not be relied upon by you in evaluating the merits of investing in HarbourVest funds or in any other investment decision.