September 4, 2024 | 6 min read
Conventional wisdom has long held that lending to smaller companies typically entails greater risk but is rewarded by higher yields and tighter structures. Conversely, very large private equity-backed businesses have been viewed as toggling between the direct lending and broadly syndicated loan markets to obtain the most aggressive pricing and structures. This dichotomy has resulted in many investors using company size as a key parameter in portfolio construction frameworks when allocating to direct lending managers.
However, the historic relative value paradigm across private credit has shifted, and the change has important implications for how allocators should be thinking about manager diversification and constructing direct lending portfolios. Below, we debunk several myths about the risks and returns of the lower and upper middle-market and discuss how we believe allocators can begin capitalizing on the new dynamics to optimize the risk-adjusted returns of their private credit allocations.
Myth #1: Small companies offer lenders consistently better pricing
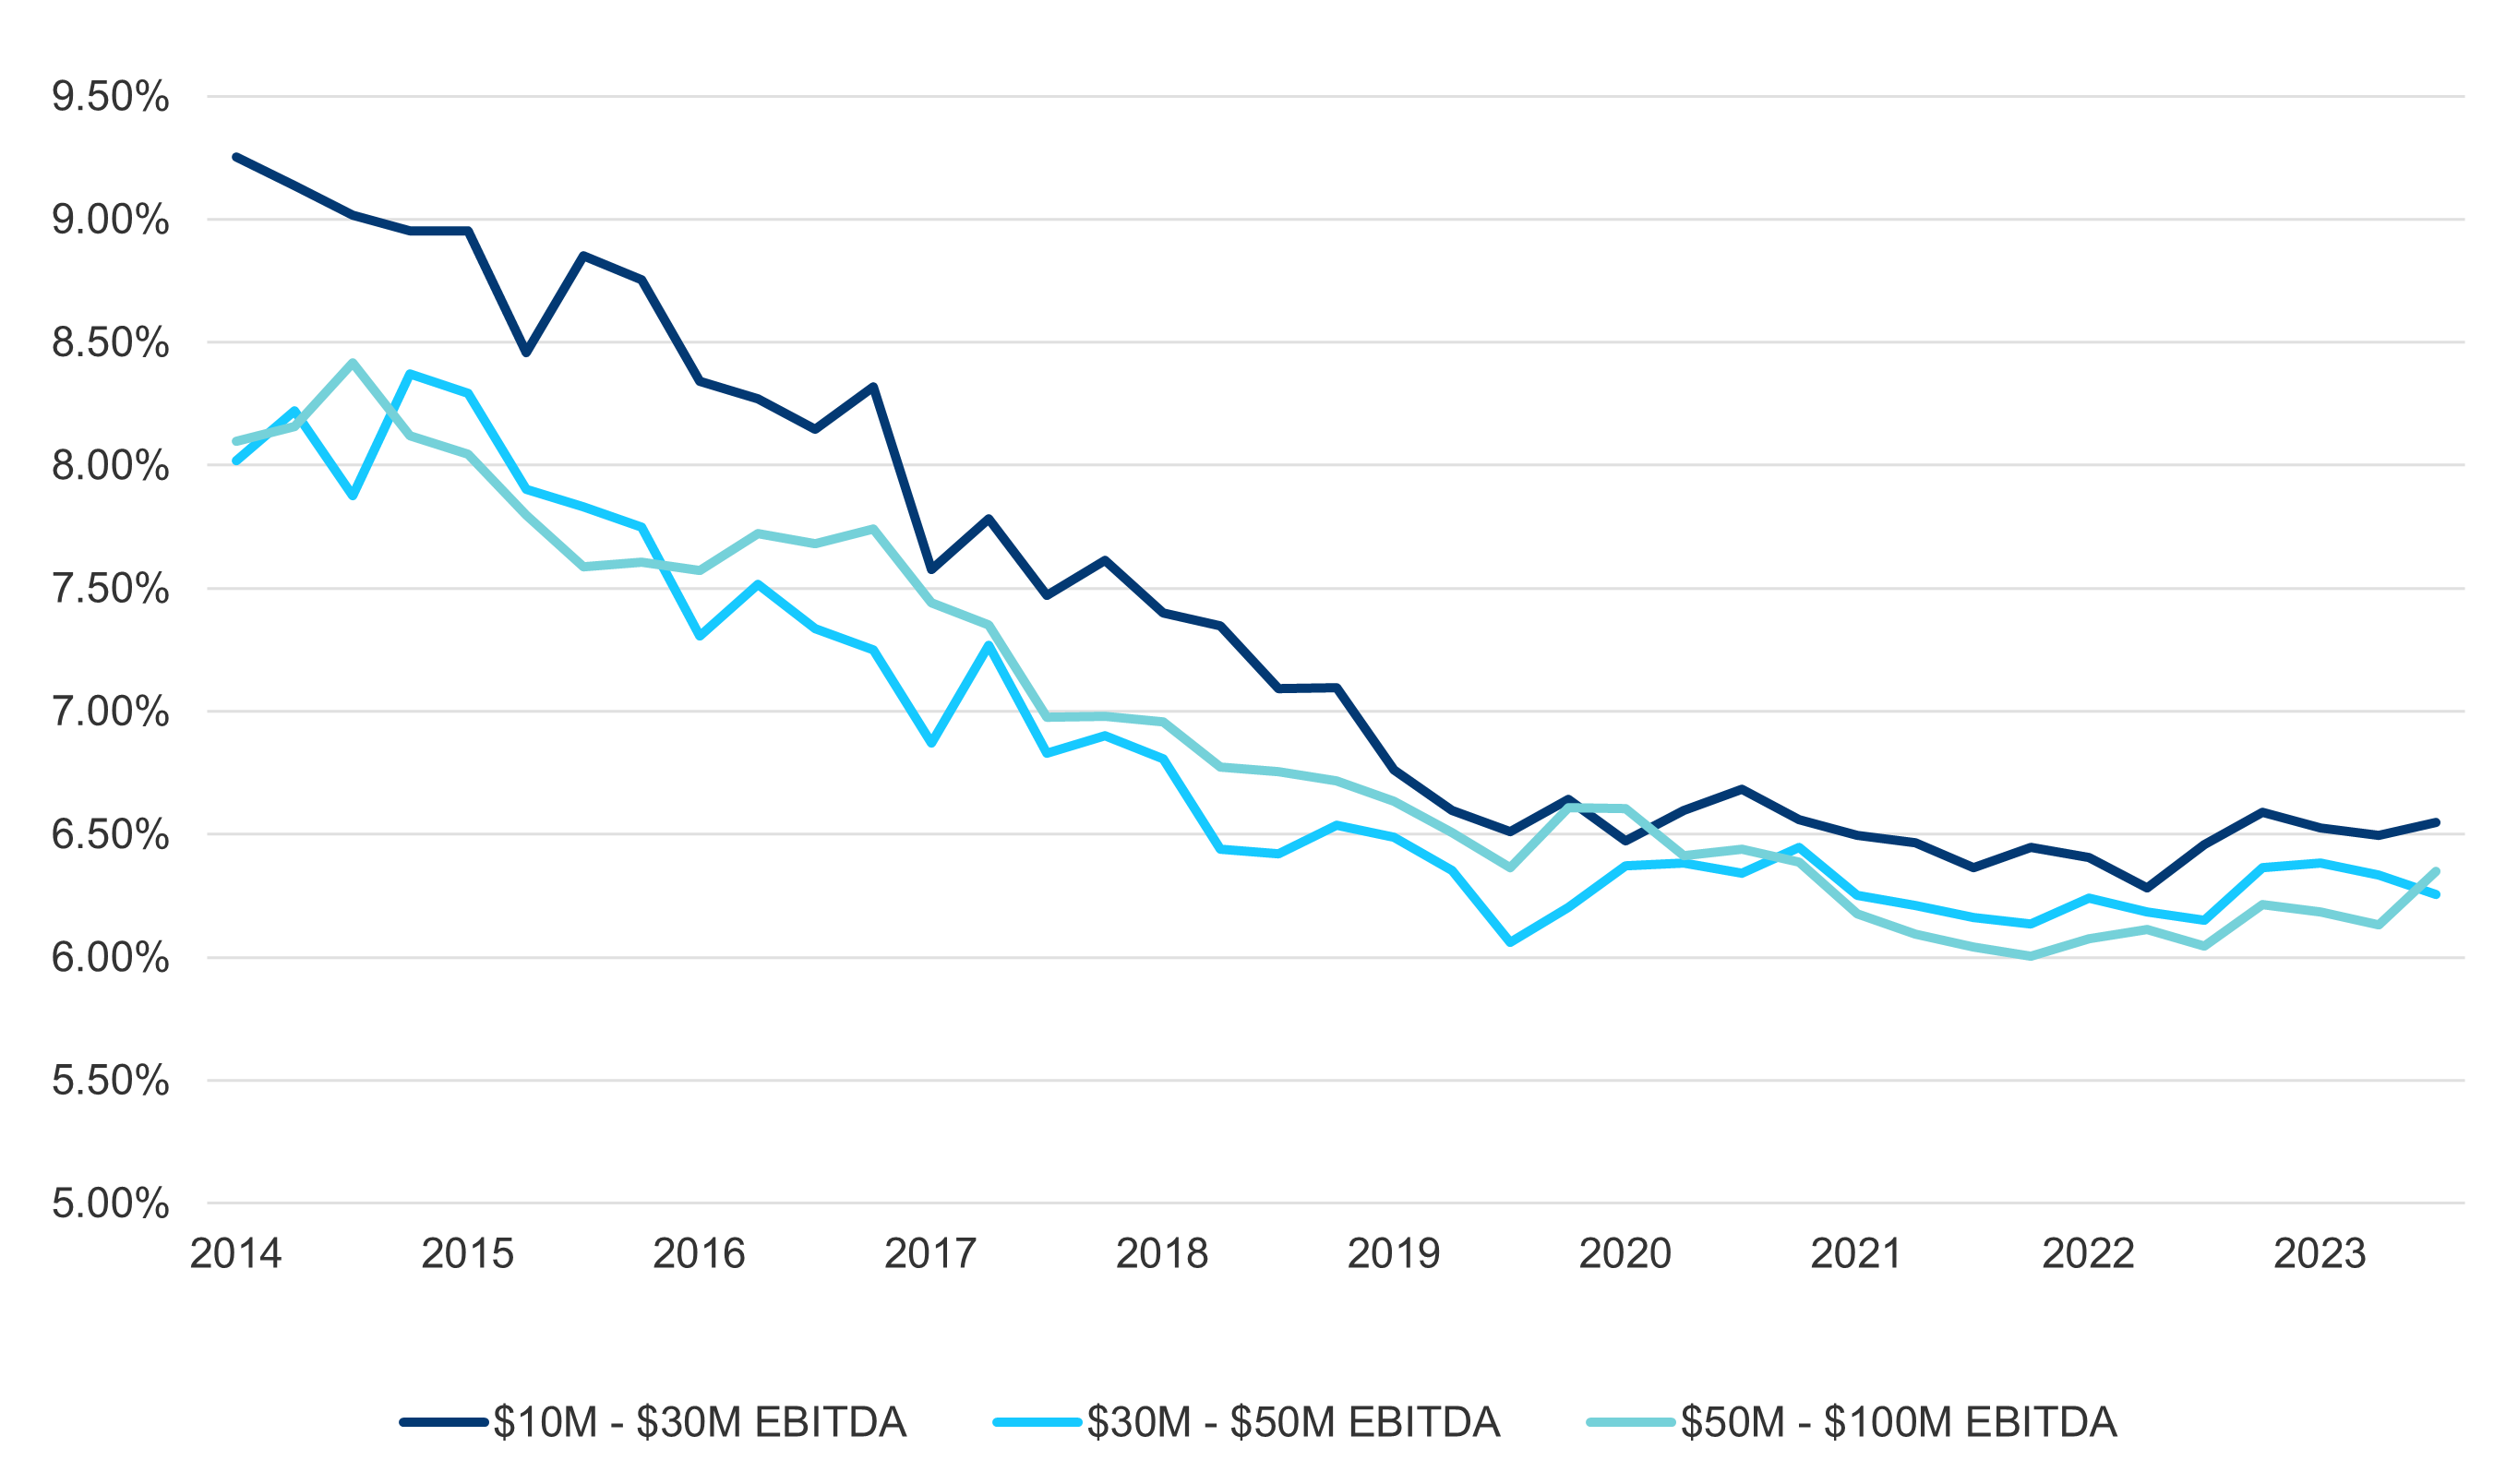
Historically, credit spreads on loans made to smaller companies offered a premium relative to loans made to larger businesses, but that premium has largely left the market. In fact, credit spreads and all-in yields today are not appreciably different across EBITDA sizes. Below is a 10-year look back at average credit spreads broken out by EBITDA cohorts.
Credit spread by EBITDA range
Source: Lincoln Financial, data range 3Q14-1Q24.
Notably, pricing has converged across the market in the last four years with the spread differential decreasing from 116 bps to 20 bps between the smallest and largest tiers.1 As more direct lenders enter the market and several mega-funds look to broaden their investable universe to hit deployment targets, the historic spread differential between the upper and lower middle-market has collapsed. We do not expect this trend to reverse, particularly since the small-market segment has gained permanent sources of capital that will continue to compete and reinforce this convergence trend.
Myth #2: Smaller companies have less leverage and are less risky
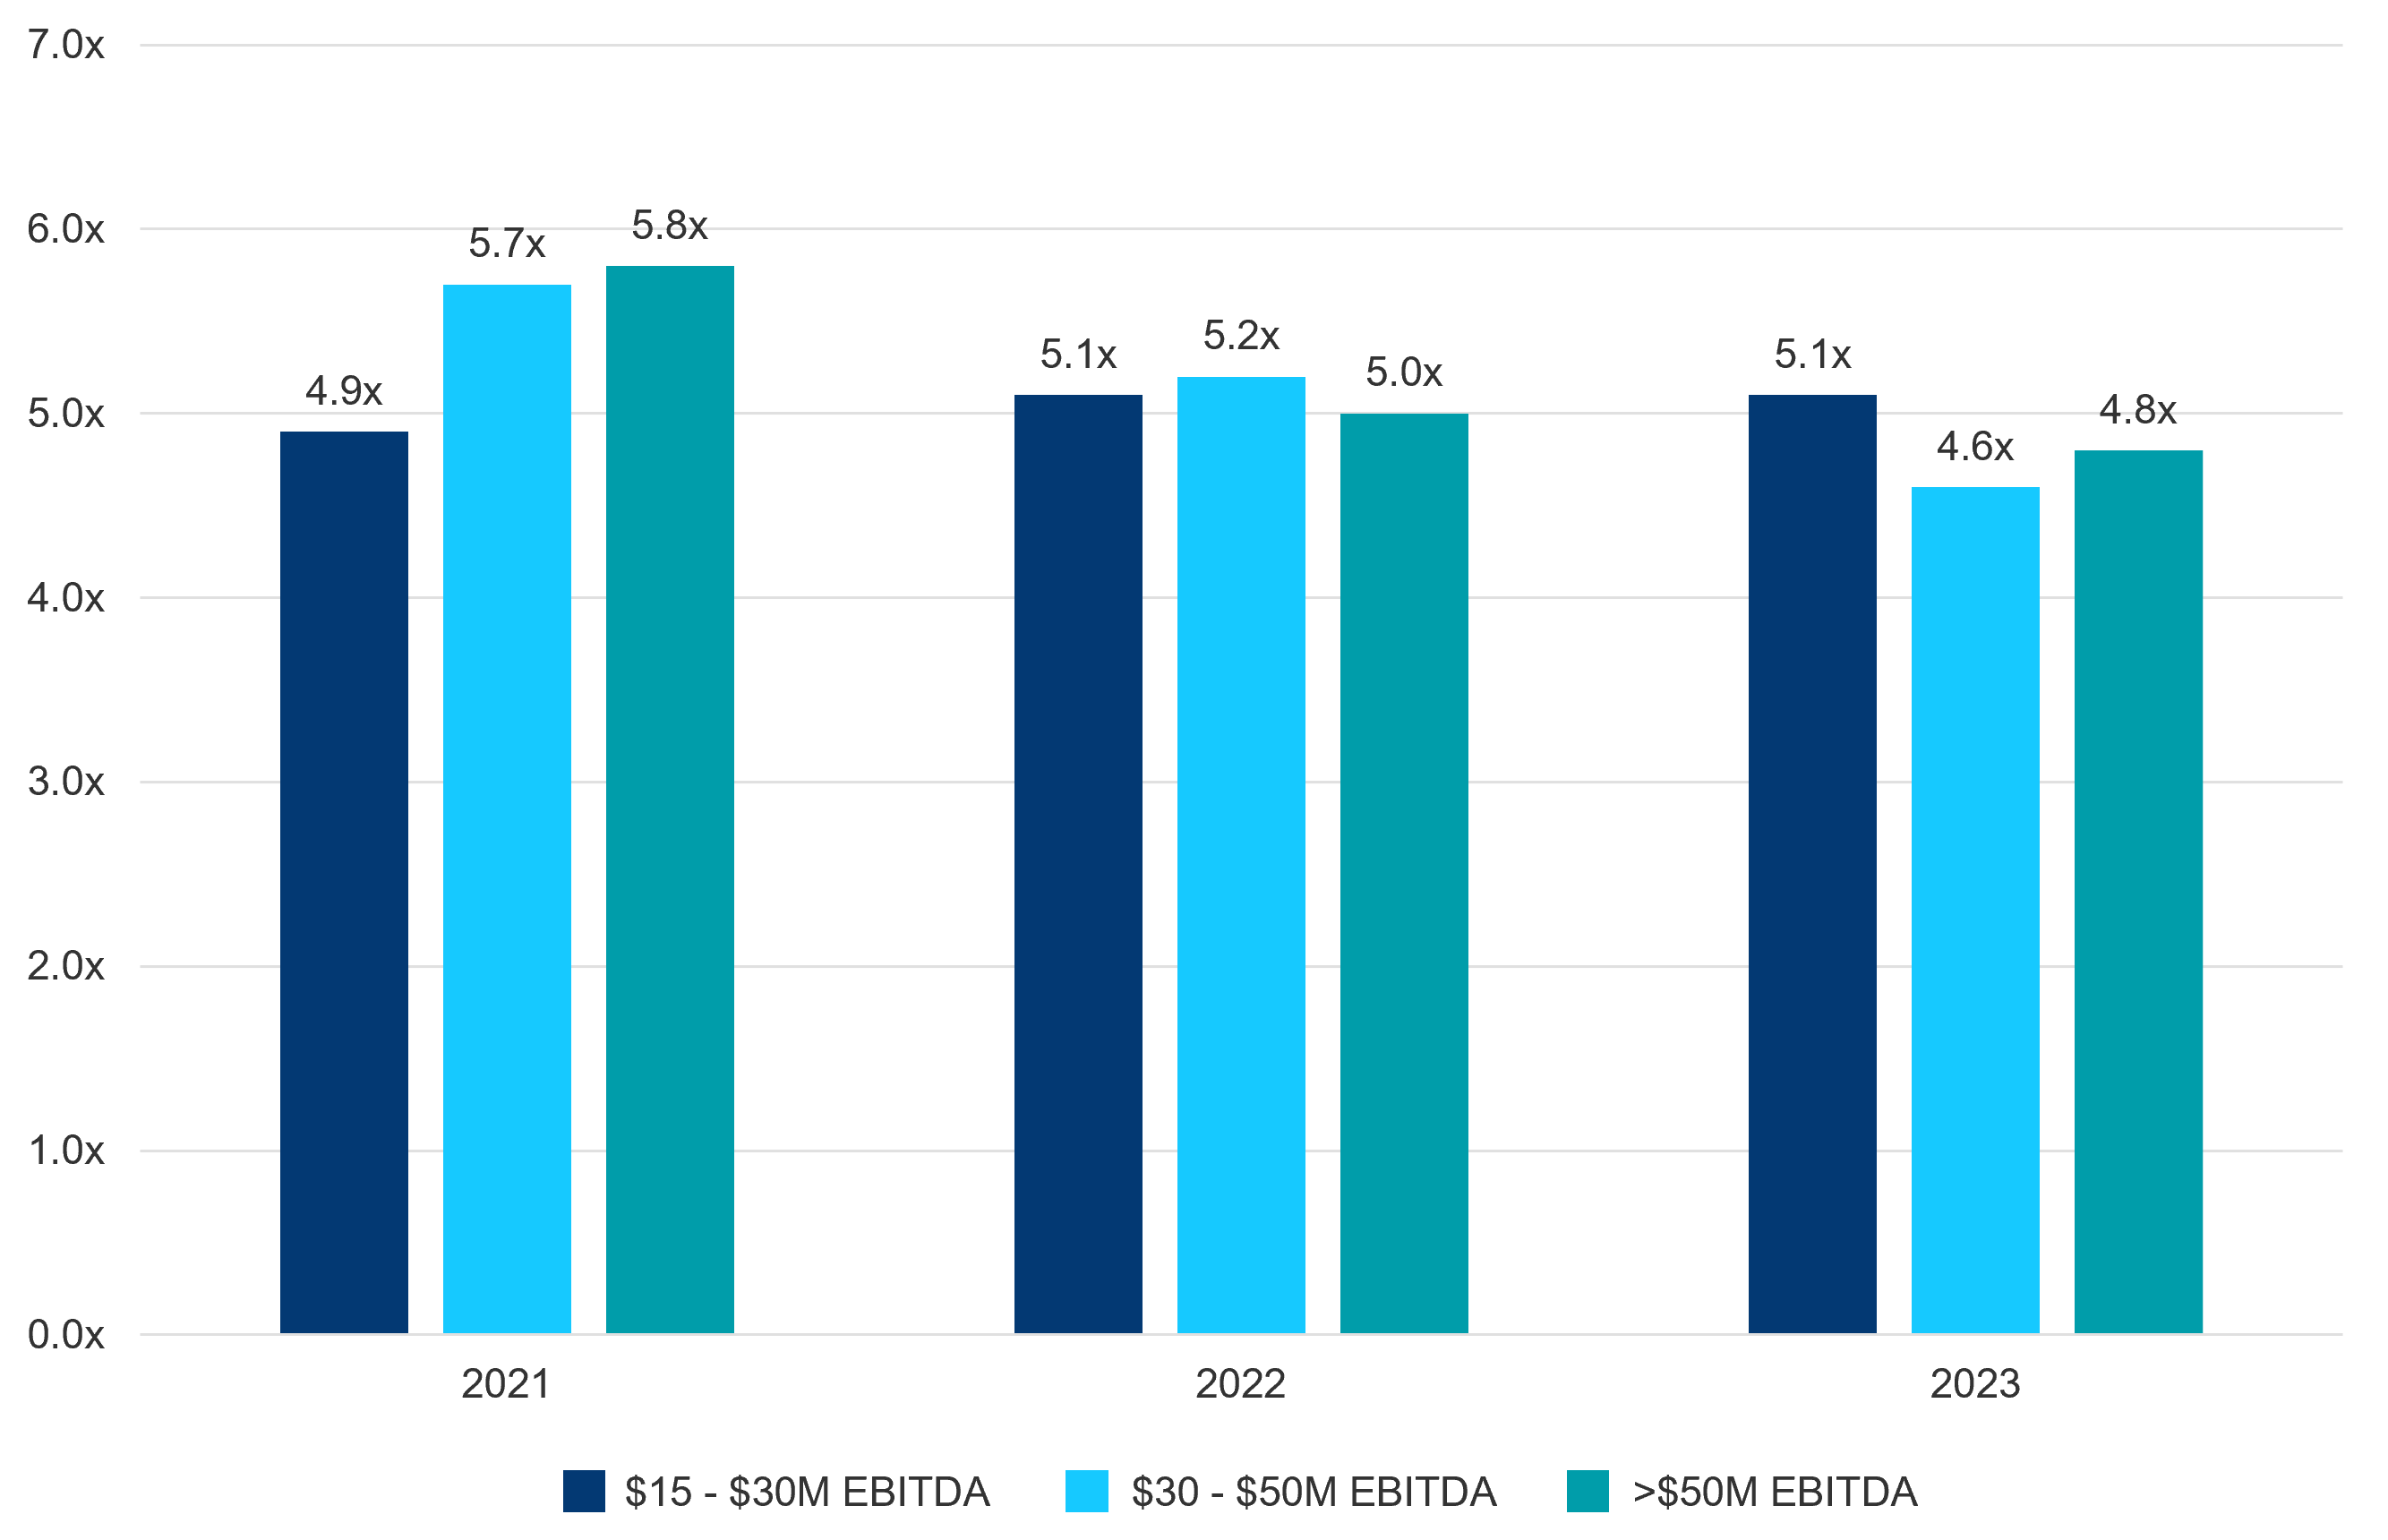
Leverage levels have increased for small companies over the last three years relative to their larger peers, debunking the view that smaller companies use less leverage, and in turn, are less risky. Additionally, it is important to evaluate leverage alongside a borrower’s loan-to-value (“LTV”) to provide a more comprehensive measure of risk rather than relying on leverage alone. The median LTV for businesses with less than $10 million of EBITDA has been ~36% over the last 10 years, which compares to 33% for businesses with $50-$100 million of EBITDA.2 In an environment like today where leverage and LTV are similar across the company size spectrum, larger companies often offer the potential for more compelling relative downside protection.
Average leverage by EBITDA profile
Source: Proskauer, data as of December 31, 2023.
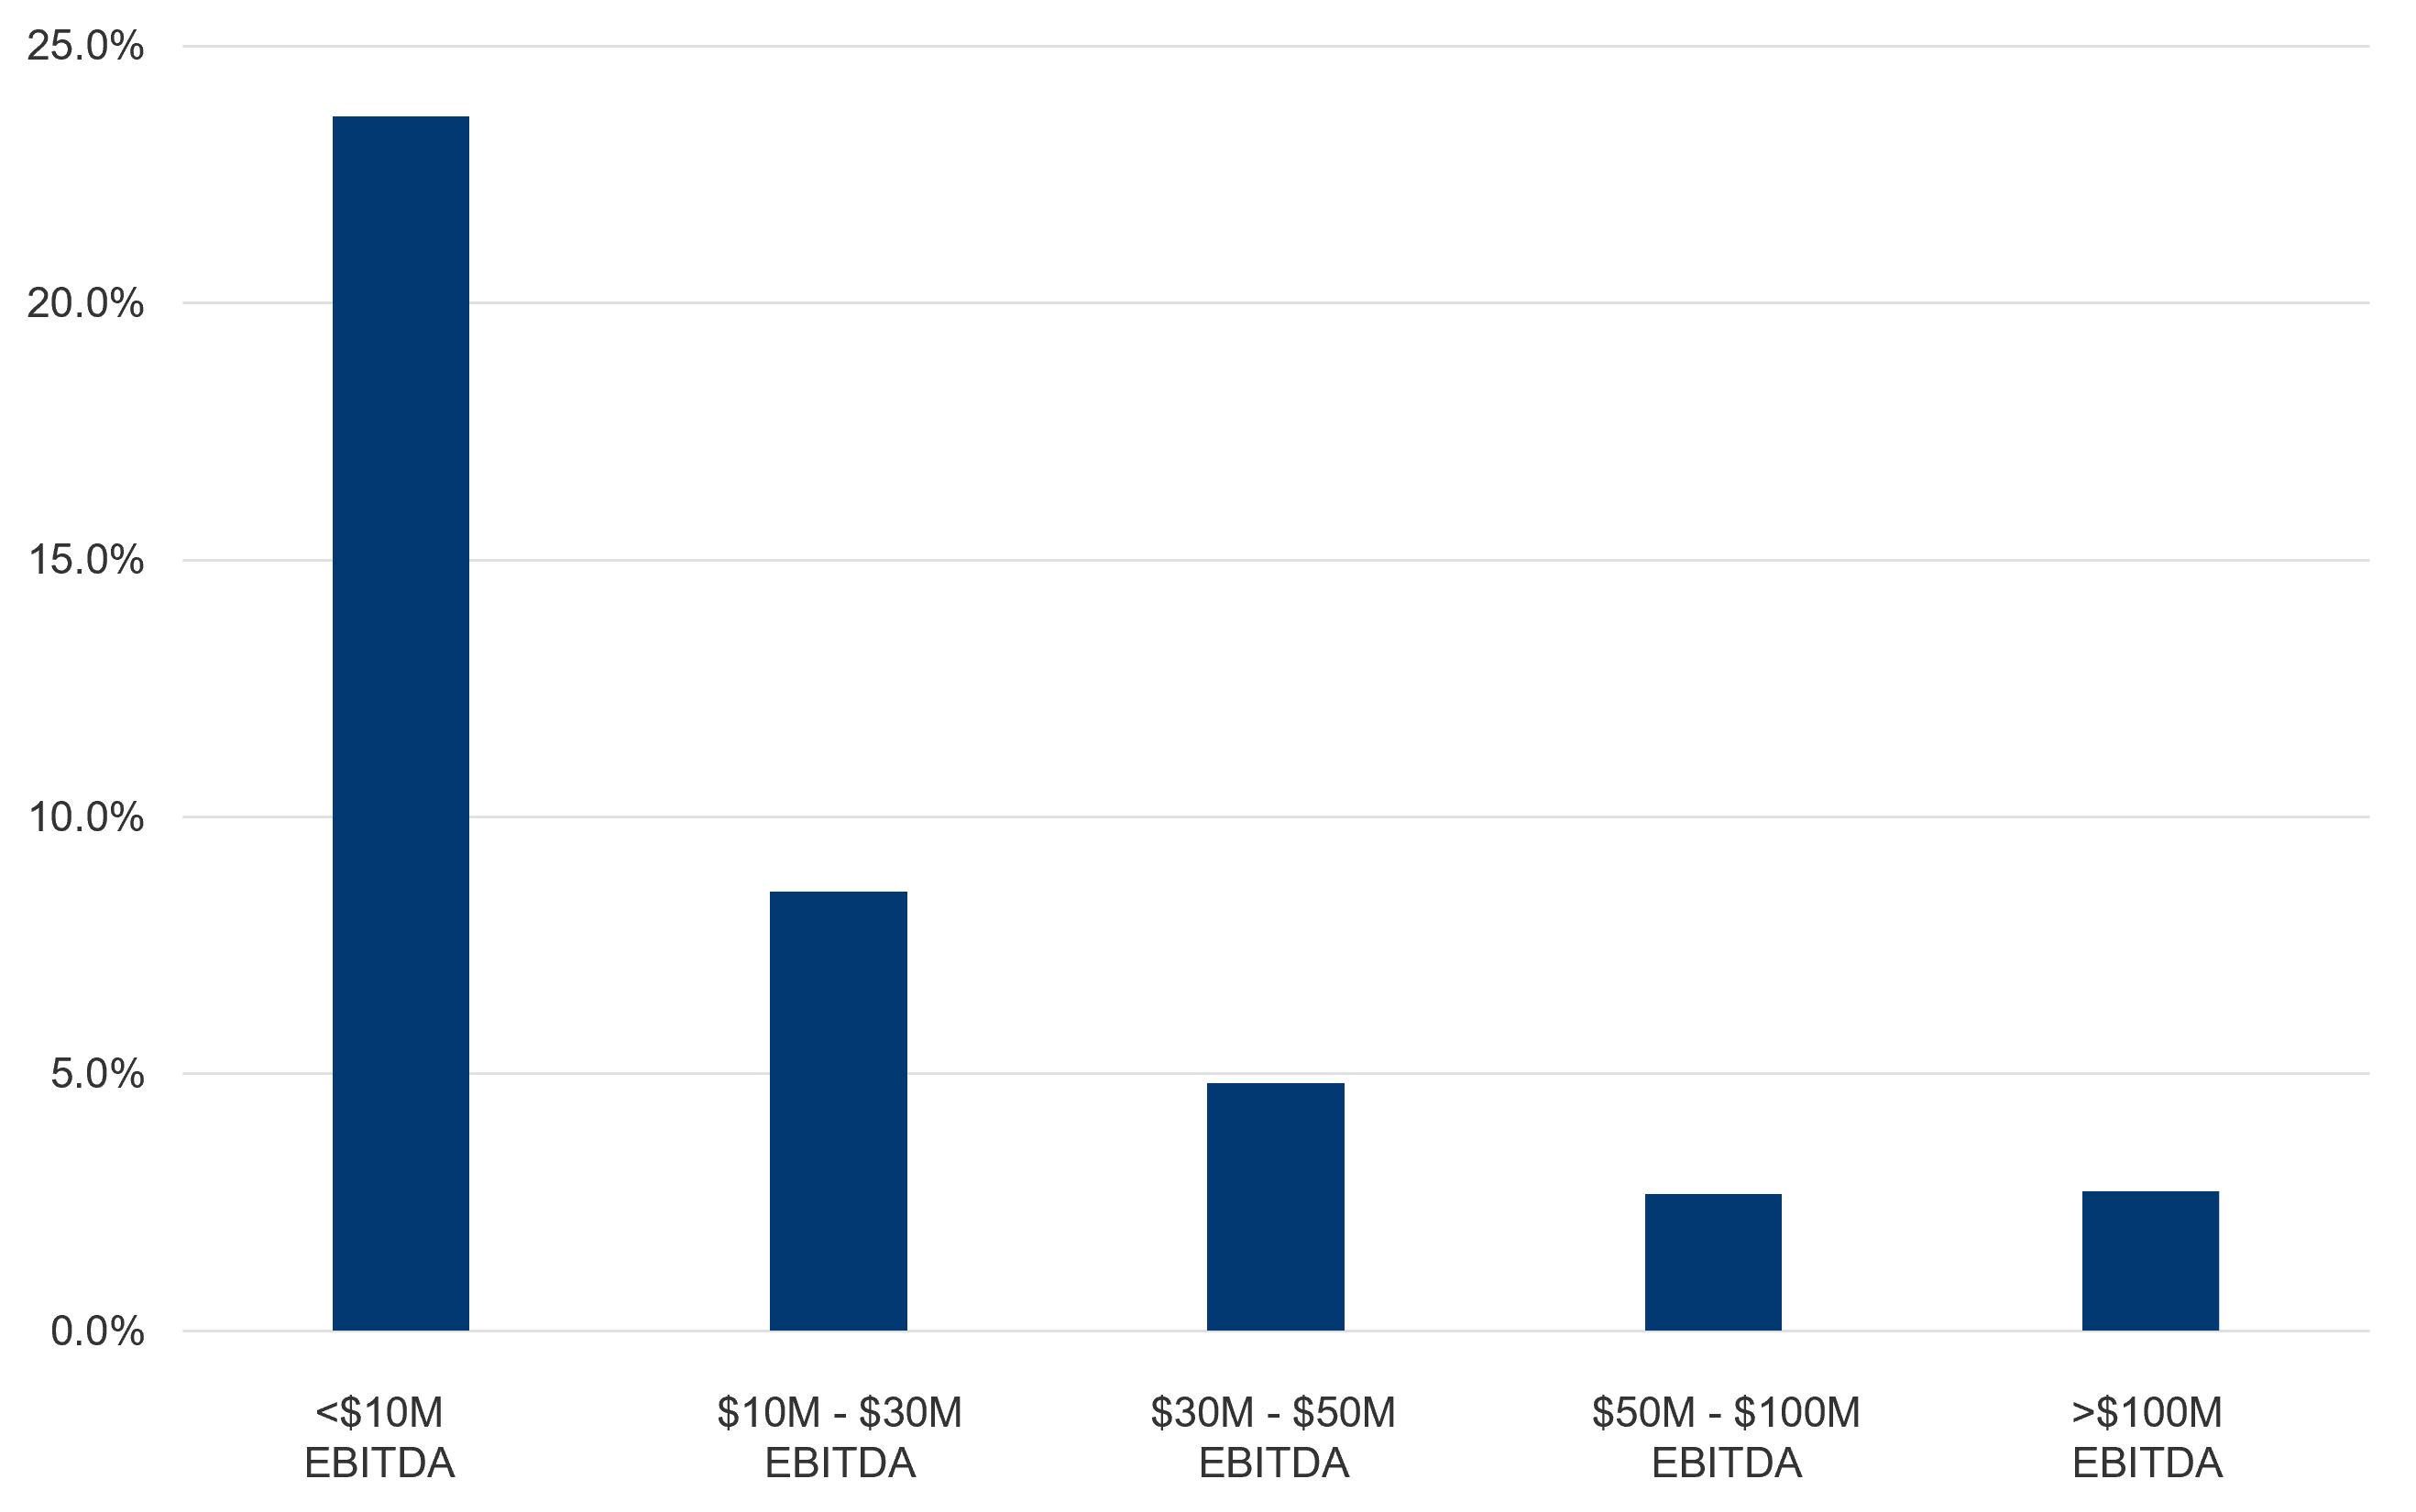
A look at company financial performance creates an even more stark comparison. Upper middle-market companies have recently demonstrated an ability to de-lever more quickly than their smaller counterparts by growing their EBITDA faster, with the upper middle-market growing at a pace of 6.8% in Q2 2024 versus lower mid-market EBITDA growth of 3.1%.3 In addition, lending to smaller companies generally entails taking different types of risks relative to larger, more established companies. For example, larger companies tend to have greater end-market and geographic diversification, less customer concentration, higher market share, and generally more flexible cost structures. These companies also often have deeper and more sophisticated management teams, especially as it relates to financial controls, and less key-person risk within the management team. In a downside scenario, larger companies have more cost-saving levers at their disposal and larger capital bases that can absorb the substantial costs of restructurings. As a result of these business dynamics, smaller companies have exhibited higher covenant and payment defaults than their larger counterparts, as illustrated below, which dispels the notion that smaller businesses are inherently less risky.
5-year average default rate by EBITDA cohort
Source: Lincoln Financial, as of June 30, 2024. Includes both payment and covenant defaults.
Myth #3: Smaller businesses have tighter covenants creating better downside protection
Many lower middle-market lenders contend that lending to smaller companies provides more covenants and tighter loan documents which serve to mitigate a portion of the small company risk. But the data suggests otherwise, particularly as it relates to covenant protections. The chart below compares the percentage of deals that have a meaningful financial covenant (typically a leverage test) versus those that are covenant-lite or covenant-loose. It is important to note that that while “covenant-loose” deals do include a financial covenant, these covenants are typically set with such a wide cushion that they often serve as window-dressing rather than offering true downside protection.
2023 covenant protections by EBITDA profile
Source: Proskauer, calendar year data as of December 31, 2023.
Myth #4: Bigger is always better
The direct lending market has witnessed a meteoric rise of the mega-unitranche deal, typified by lending to companies with $200-$300 million of EBITDA or more. In the first half of 2024, approximately 22% of unitranche deals were $500+ million facilities, compared to only 3% of deals just five years earlier.4 The volume of these large deals ballooned during the depths of the COVID-19 pandemic when public forms of financing such as the broadly syndicated loan (“BSL”) and high-yield markets were largely unavailable. While these deals often represented excellent relative value when public markets were shut, in 2024, these deals have grown susceptible to refinancings through the public markets or negotiated re-pricings with many direct lenders now accepting lower spreads or more aggressive terms to maintain exposure to these loans in today’s market.
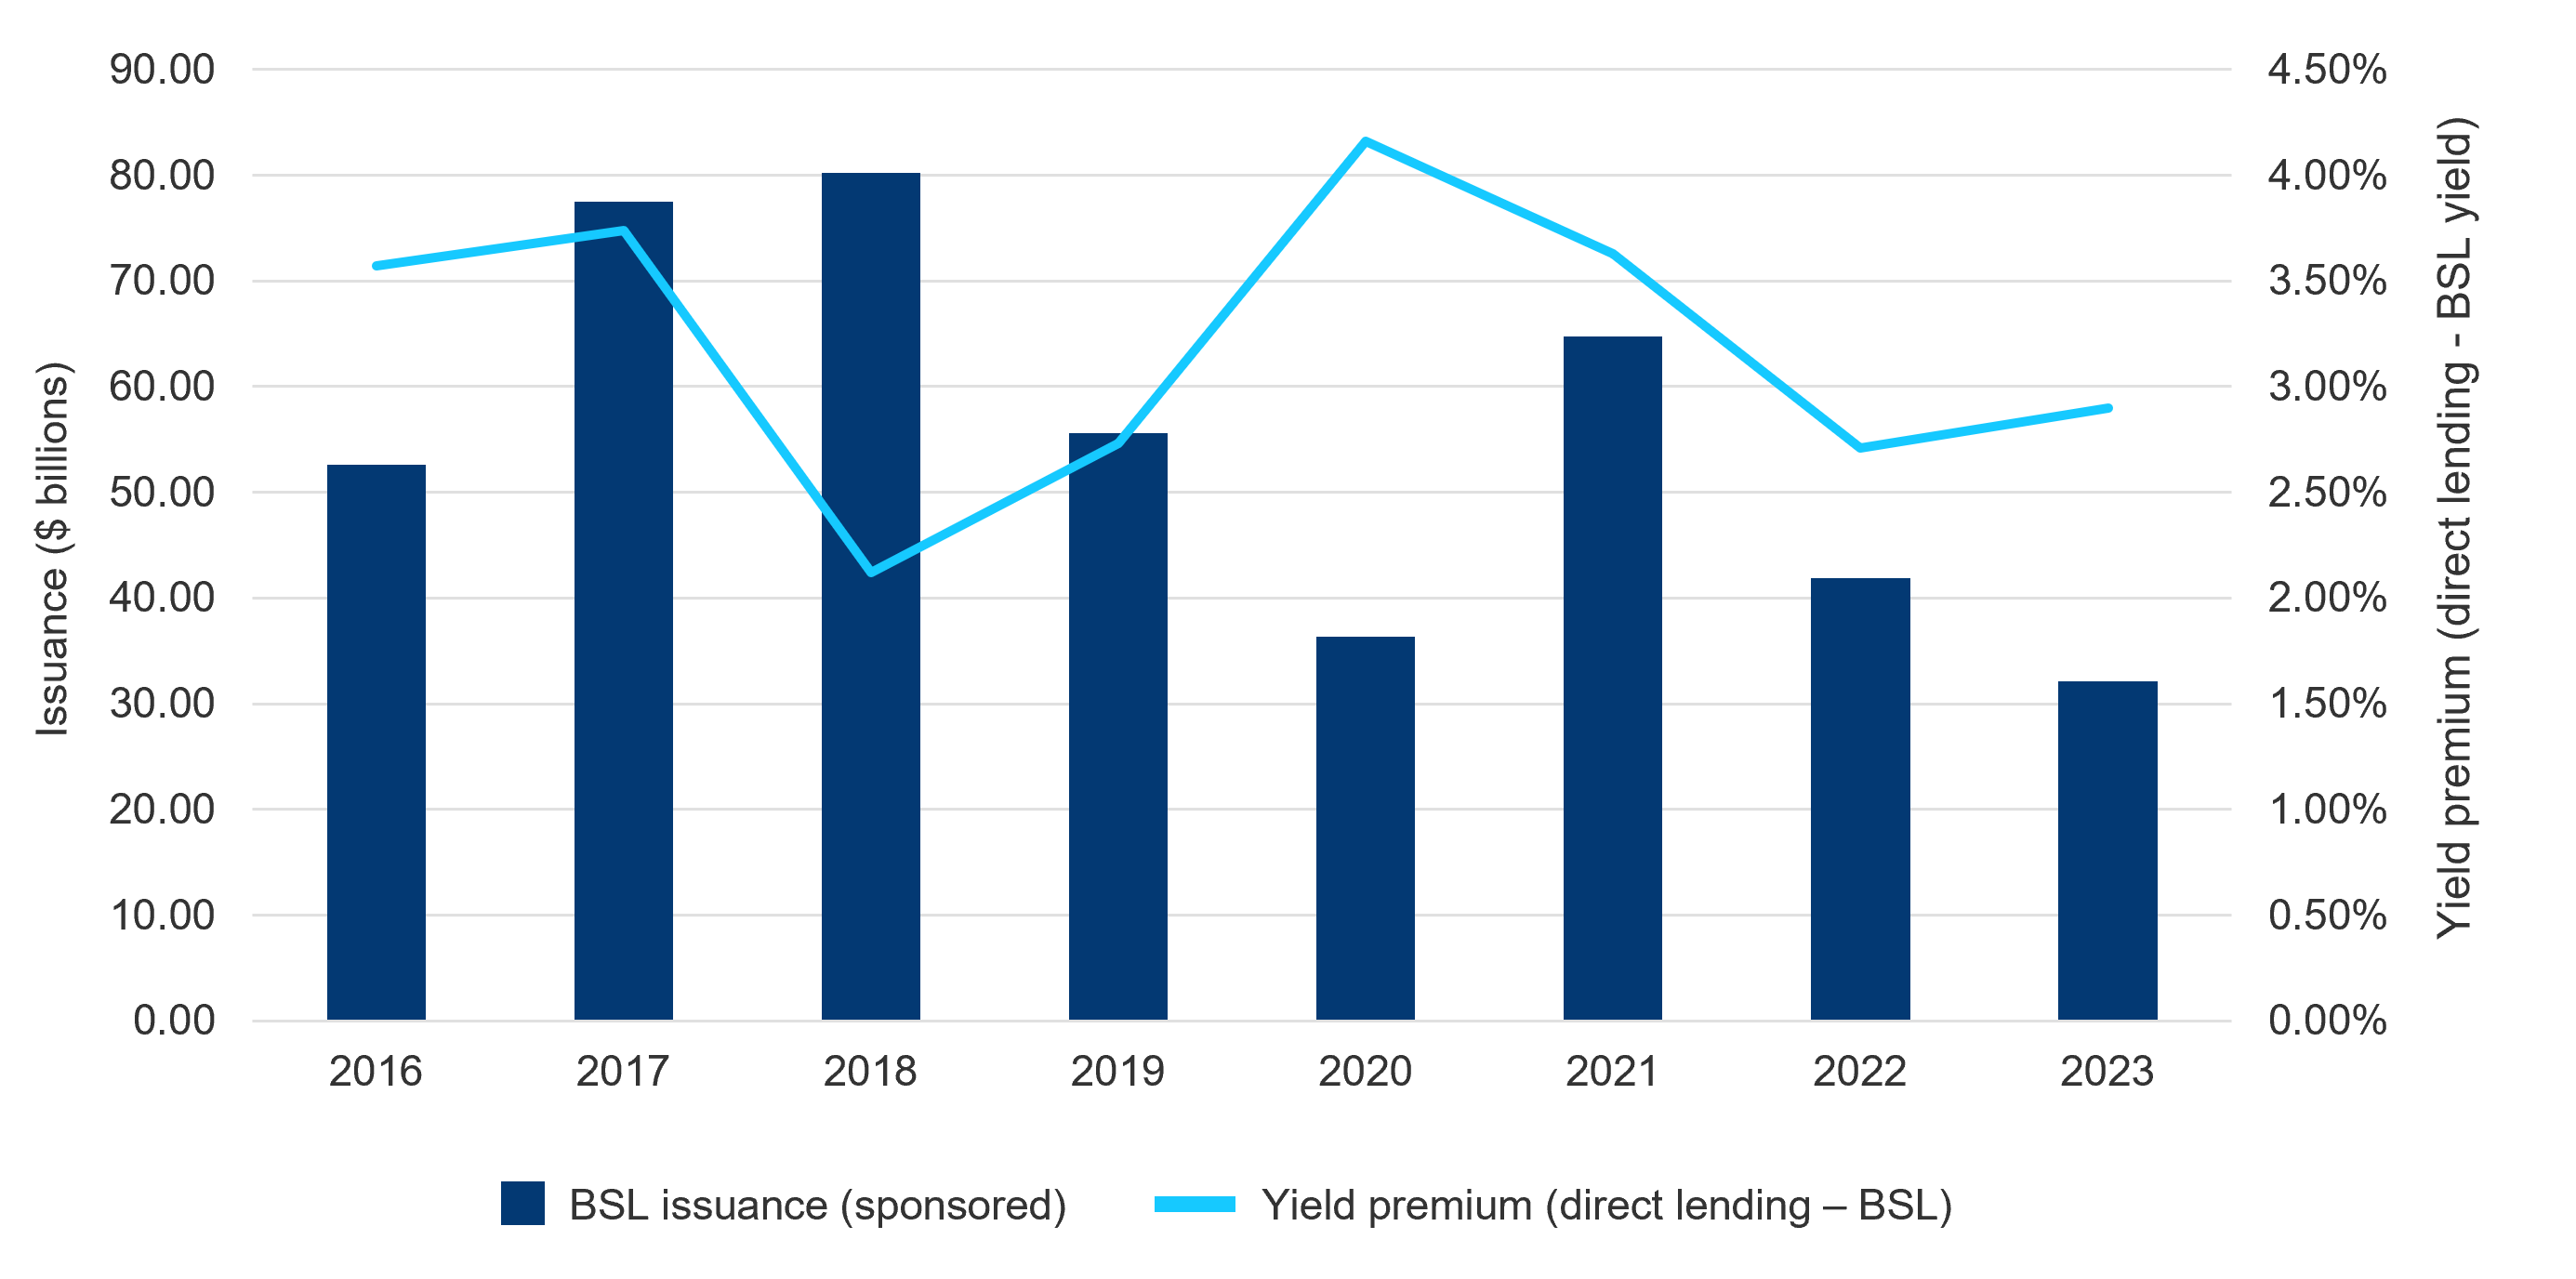
During periods like the current environment where the BSL market is open and active, private credit spreads tend to tighten, especially at the large-end of the market to reflect this competition. The chart below shows direct lending offering the greatest premium to the BSL market when BSL issuance is at its lowest, such as in 2020.
Broadly syndicated issuance vs. private credit premium
Sources: Middle-Market (MM) Unitranche yield data sourced from London Stock Exchange Group, BSL yields represented by the Morningstar LSTA US Leveraged Loan 100 Index. Data is based on weighted average yields (%) as of December 31, 2023. Past performance is not a reliable indicator of future results.
Accordingly, we believe that very large private credit borrowers can offer compelling risk/return, but caution against putting too many eggs in this very large basket given this segment’s heightened sensitivity to public market volatility.
Finding the optimal middle ground: Implications for portfolio construction
Today’s environment presents allocators with two polarizing market trends: mounting small business risk in the lower middle-market despite a convergence in credit terms across deal sizes, and heightened competition between the BSL and private credit markets that is diluting returns among the largest borrowers.
While very large, mega-unitranche deals can offer compelling risk/return when the BSL and high-yield markets are shut, it is difficult to predict when these market fluctuations will occur. Accordingly, exposure to the largest private credit deals is best positioned opportunistically within a diversified portfolio. Conversely, we believe that the growth of private credit as an asset class and the level of competition for lower middle-market deals has resulted in a more lasting convergence in terms between lower, middle, and upper middle-market direct lending transactions.
In light of similar pricing and structures, we favor businesses that are large enough to demonstrate the needed scale and resiliency to withstand bumps in the road versus smaller, less diversified businesses. We have identified a growing “sweet spot” for opportunities residing between the lower and the upper middle-market where investors can strike a balance of capturing attractive all-in yields plus more attractive credit fundamentals. These opportunistic businesses typically generate between $50-$150 million of EBITDA and exhibit the favorable characteristics of larger businesses while still offering competitive yields due to their lack of access to the BSL market.
Key Takeaways
Given the dynamic and evolving nature of the direct lending market, we offer allocators three key takeaways based on the data presented and our market observations. We believe that these approaches support delivering the most consistent, all-weather returns within today’s direct lending environment:
- Lending to lower middle-market companies can expose allocators to increased risk without the commensurate return in today’s market, a trend we see as likely to continue.
- Managers can distinguish themselves by demonstrating the flexibility to invest up and down the EBITDA spectrum to capture the best risk-adjusted returns, as opposed to maintaining rigid allocations to the lower, middle, and upper middle-markets segments.
- In today’s market, we believe that private credit investors should seek to allocate to managers that focus on the true middle of the middle-market — the $50 million to $150 million in EBITDA — and demonstrate flexibility to invest across the company size spectrum, thereby responding dynamically to the shifting relative value landscape.
Would you like to discuss private credit investing?
- Lincoln Financial, data range 3Q14 – 1Q24.
- Lincoln Financial, data as of June 30, 2024.
- Refinitiv, data as of June 30, 2024.