
June 12, 2024 | 12 min read
Private markets are demonstrating agility and resilience, absorbing the interest rate shocks of North American and European central banks and charting a reinvigorated growth trajectory through a year of geopolitical volatility and global election year uncertainty. Exit and dealmaking activity — largely frozen for much of 2023 — are starting to thaw as both LPs and GPs continue to seek liquidity and as more stable economic conditions create fertile ground for new deal activity. The wheels of the cycle are starting to turn once again, which we believe will eventually lead to the beginning of the end of the liquidity squeeze.
Together, we see plenty of opportunity to come. Below, we offer our perspective on where private markets are today and key trends for the rest of 2024.
A more durable macro backdrop emerges
"The question on most private market investors’ minds is likely to be when liquidity will accelerate to spur (re)investment."
John Toomey, Managing Director, HarbourVest Partners
In January, expectations were for multiple rate cuts through 2024. Since then, consensus has shifted following stickier than expected inflation in key markets, such as the US and Europe. While the European Central Bank (ECB) recently cut rates, and the Bank of England (BOE) may consider conservative cuts over the summer, the Federal Reserve is signaling a more patient stance. Some are now forecasting higher for even longer, potentially signaling a period of rate normalization as opposed to rate cutting.
However, the inflation spike appears to have passed and rates will likely eventually trend lower. More optimistic GDP growth forecasts from the International Monetary Fund (IMF) in April are also positive signs. The US is expected to perform better than previously anticipated through 2024, with a projection of 2.7% growth (up 30% on the January forecast) and the outlook for advanced economies is also improving to 1.7% (up 10%).1
As we predicted in our full-year report, the quest for liquidity among GPs and LPs continues apace as exits remain muted. With investors unable to rely on strong distributions to fund new private markets commitments in recent years, the pressure to secure liquidity remains high — for LPs, so they can invest consistently through the private market cycles and gain vintage year diversification, and for GPs, so they can return capital to investors and raise successor funds. This is leading to strong secondaries activity, as well as some select IPO activity as GPs take advantage of improved public market sentiment through 2024 and opportunities emerging in the current private market cycle.
While overall exit activity was down by value, the proportion of exits via IPO rose from 6% in Q1 2023 to 16% in Q1 2024, or $7B more in absolute terms. The success of private equity and venture capital-backed IPOs Galderma, Renk, Reddit and Rubrik since listing may pave the way for further public listings and improve exit confidence overall. While exits continue to be slow, investment activity — a more organic reflection of investment sentiment — rose in Q1 2024 versus the prior year, yet another indication of thawing.
Global buyout investment volumes
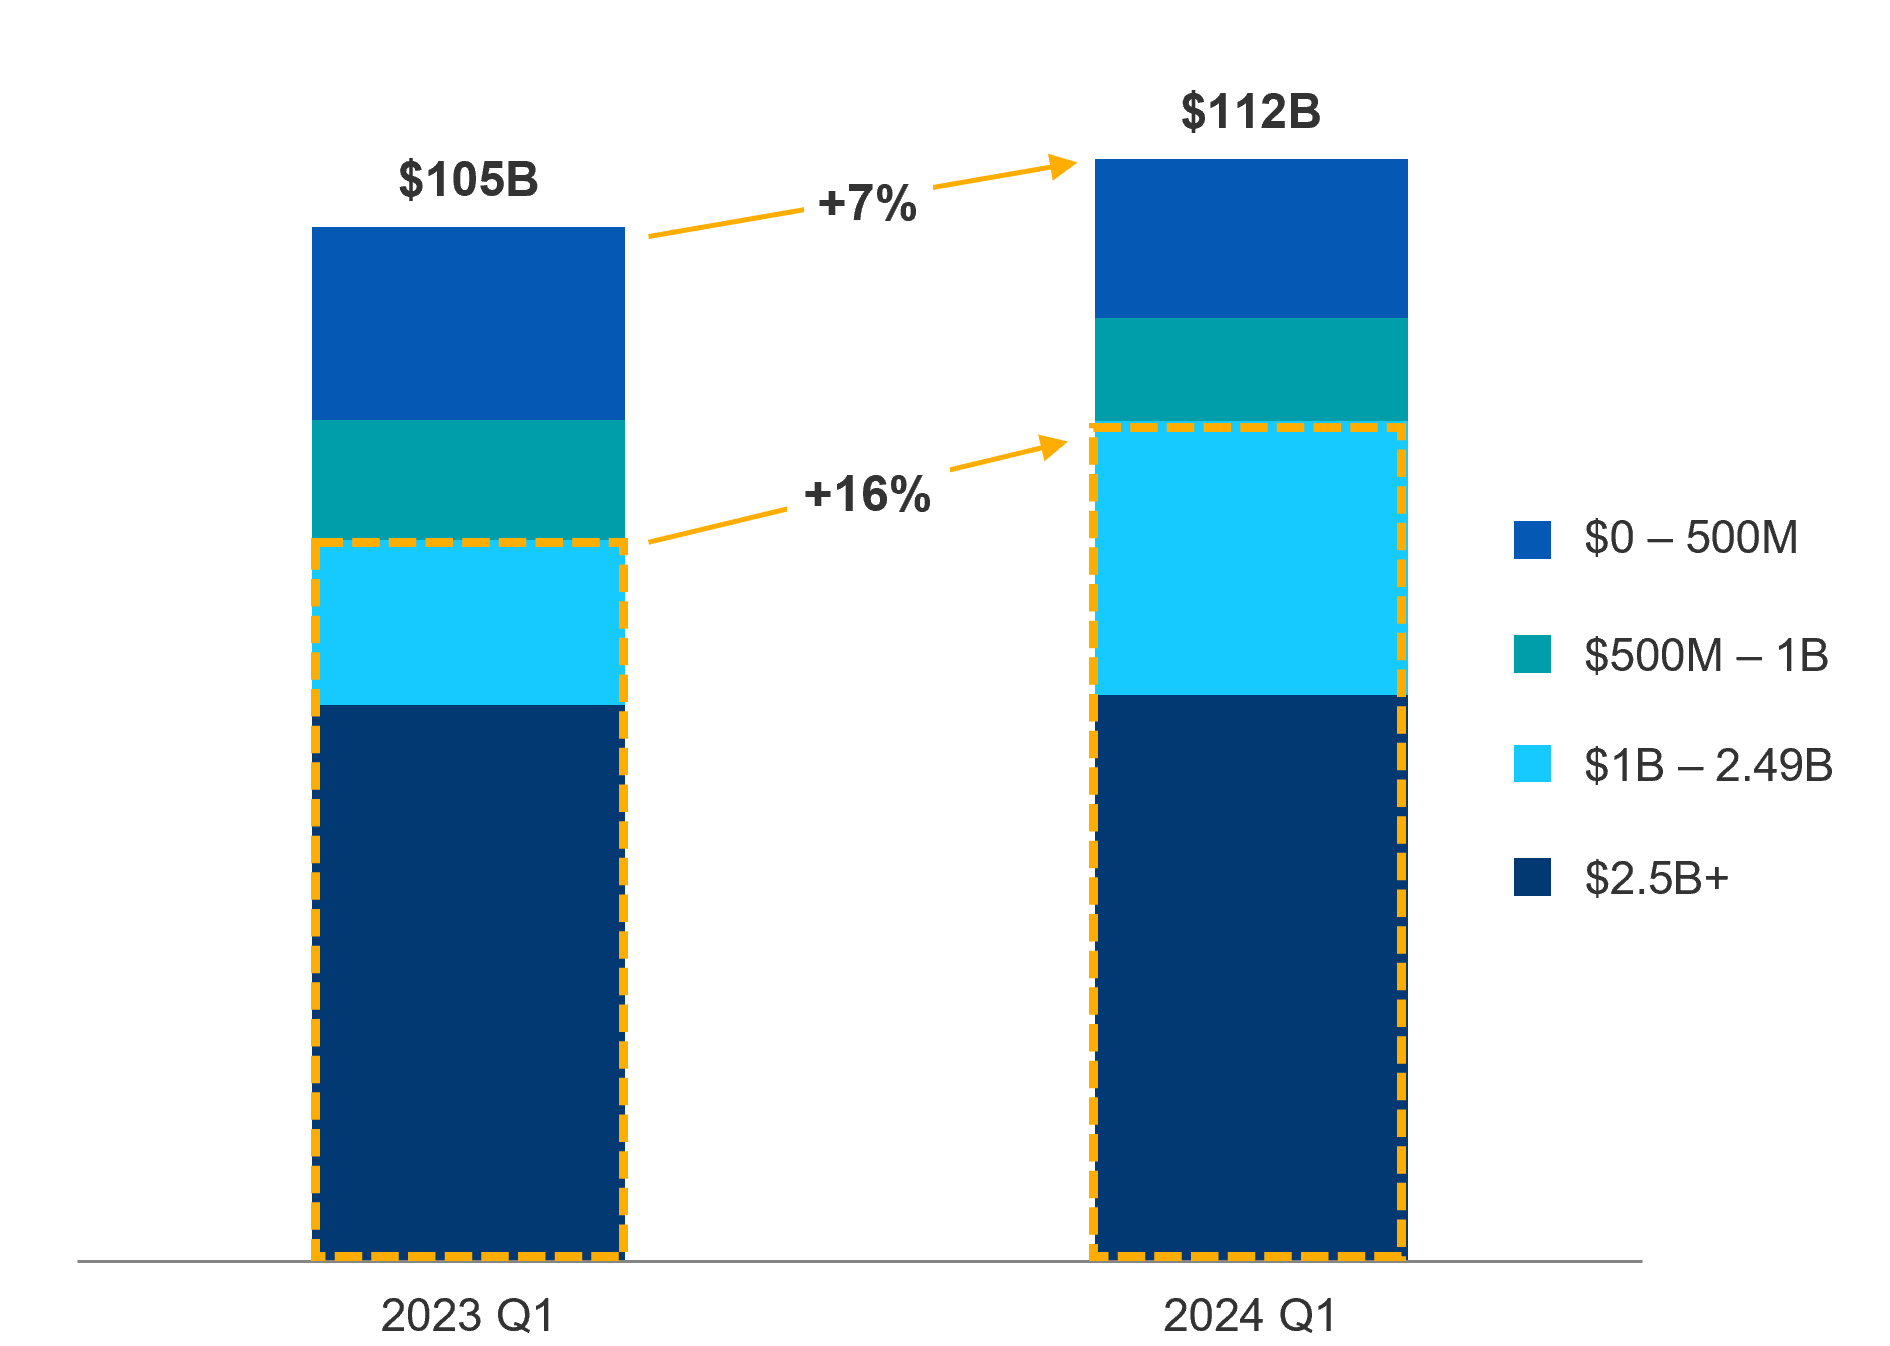
Source: PitchBook as of April 24, 2024.
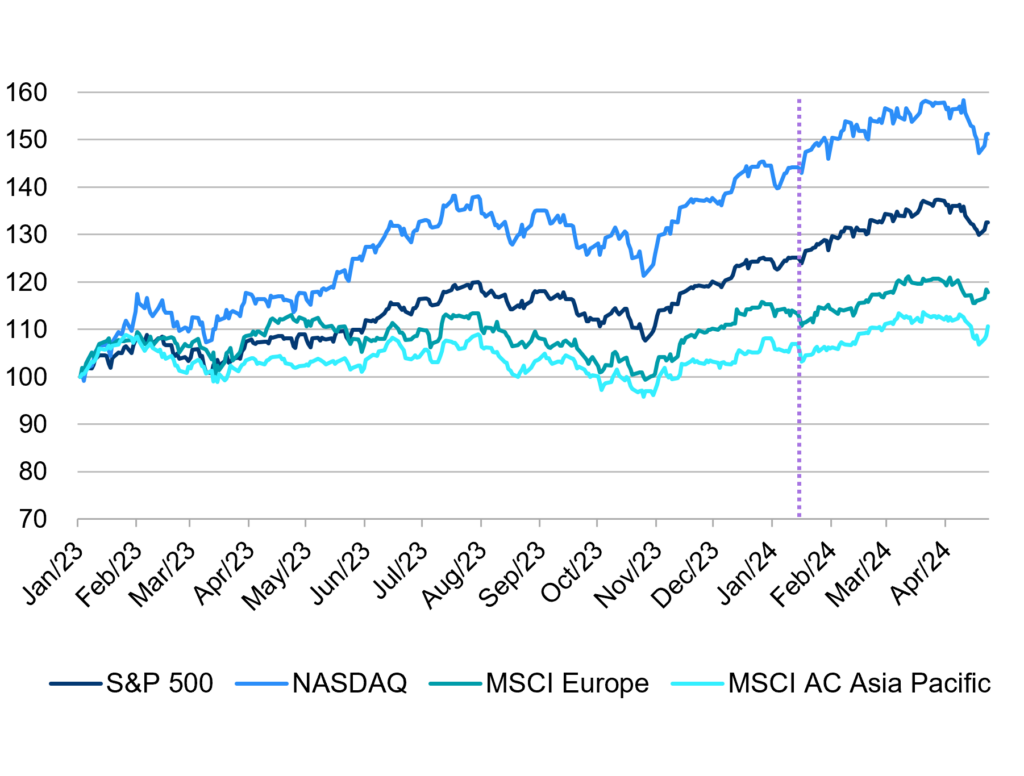
Indeed, a public markets recovery that started with the Magnificent 7 technology stocks, buoyed by the prospects of growth from AI capabilities, has become a broader rebound over recent months: in 2023, these seven stocks contributed 61% to S&P 500 returns; in 2024 to April, this had fallen to 41%. Overall, the S&P 500 is up over 28% year-over-year to 15 May 20242 and the MSCI ACWI World Index rose more than 18% year-on-year to 30 April 2024.3
Public markets
Magnificent-7 Contribution to S&P500 Returns*
2023
0
%
2024 YTD
0
%
Source: S&P Capital IQ as of April 24, 2024.
This market performance is helping to lift sentiment across the board. We’re already seeing M&A at the larger end of the deal spectrum beginning to return, with $10 billion-plus deals in the US and $1 billion-plus transactions in Europe on the rise,4 which suggests improved confidence among companies and investors over the past few months. This will likely smooth the path for more dealmaking across the deal size spectrum through 2024.
Considering the full macro picture, we are confident that we are entering a new phase of the private markets cycle wherein we will see exit and deal numbers pick up, followed soon after by fundraising.
25%
Regional updates
North America: Growth despite higher rates
Even with Federal Reserve interest rates being kept higher for longer and the upcoming US presidential election feeding into global investor uncertainty, US public markets have remained upbeat. While the positive sentiment is filtering through to private markets, publicly available Q1 deal activity numbers pre- 2021 and 2022 levels. US buyout deal activity largely moved sideways year-on-year with signs of improving, with deal count marginally up, albeit with value slightly down.5
PE deal activity by quarter
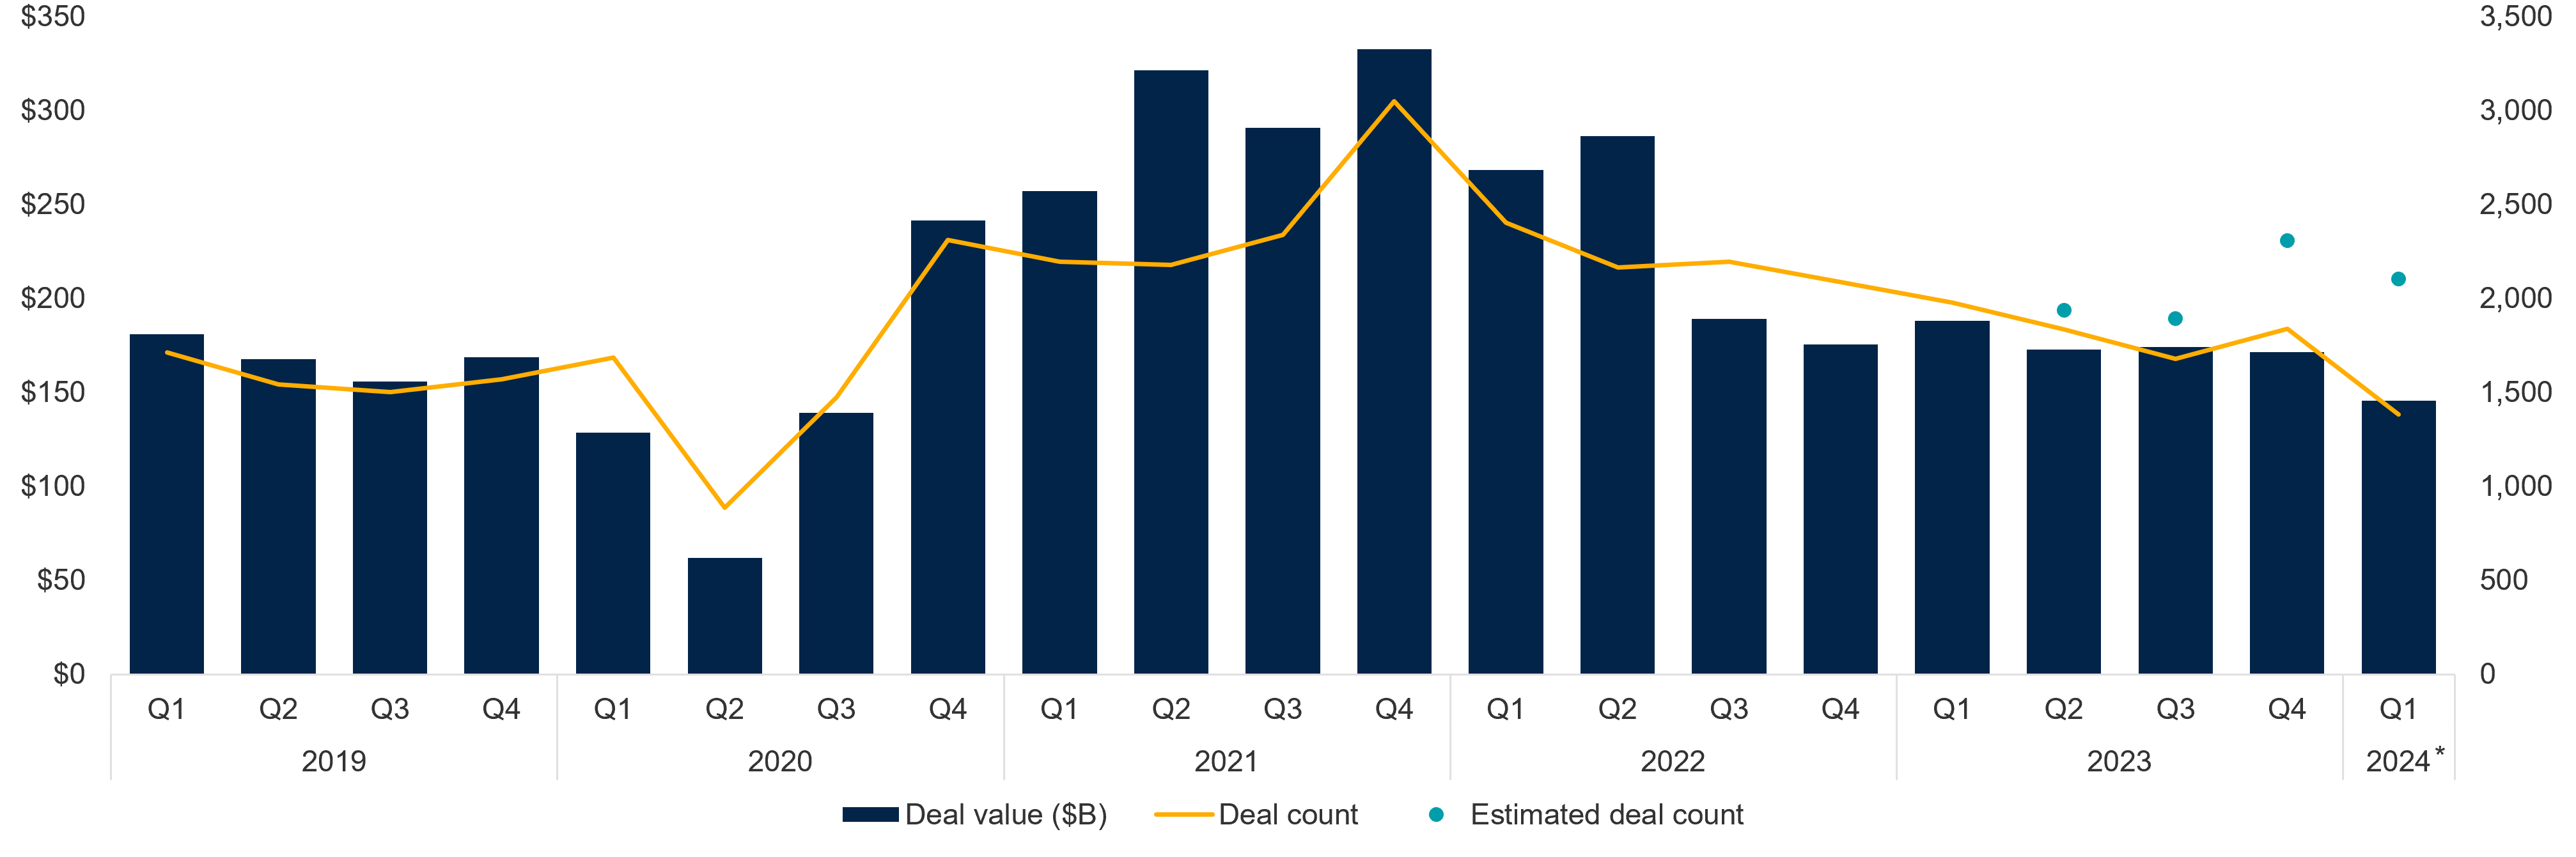
*as of March 31, 2024 | Source: PitchBook | Geography: US
In investments, take-privates were a bright spot through 2023, but receded as more buoyant public markets dampened enthusiasm for these deals in Q1 2024. Corporate carve-outs, by contrast, continued to be popular investment choices as GPs found opportunities to breathe new life into unloved and under-invested assets — over 12% of US buyouts in Q1 2024 were carve-outs, up from 10.7% in Q3 2023.6 Add-ons also took a large share of new investment by US GPs seeking to add value to portfolio companies in an environment of extended holding periods and more expensive debt.
In venture capital, where investing was broadly down in 2023 due to macro conditions and the regional banking crisis, AI continues to attract funding as investors eye opportunities to disrupt legacy industries, with a focus on seed and early-stage investments where upside potential is strong. With some notable IPOs so far in 2024, including Reddit and Rubrik, experiencing strong aftermarket performance, we expect realizations to have a stronger showing this year than last, in particular as GPs seek to return capital to LPs.
EMEA: A brightening picture
Last year ended with the region’s second highest amount of capital ever raised, at €119 billion, and totals for Q1 2024 alone stand at €61 billion. Private equity deal and exit values are down for the first quarter of 2024 across Europe versus Q1 2023, but estimated volumes are up, and the region’s fundraising continues apace. With much of this capital concentrated at the larger end, investor interest in European private equity is allowing the region’s funds to scale. However, the mid-market remains the core engine of the private equity market in Europe. Over the past 35 years, European mid-sized buyout funds have delivered a net IRR of 16.6% — a rate that is higher than all regional European segments.7
Venture capital fundraising could also receive a boost in 2024. Some of Europe’s most established GPs are expected to hit the market, with efforts potentially buoyed by innovation and commercial success of products by European leaders like Novo Nordisk with success of Ozempic/Wegovy drugs and AI cloud business like Astera Labs or Mistral AI. In Q1 alone there was nearly €7 billion of VC clean tech deal value, more than half of last year’s €11.6 billion annual total for VC cleantech.8
Overall, the picture for European private markets is brightening. The region has shown resilience and adaptability in securing its energy supplies by accelerating renewable power installation and decarbonization and worked through supply chain issues with order books recovering. These structural shifts, combined with the recent cut in interest rates by the ECB, has helped to set the stage for further private company growth. Europe’s most experienced managers are operating in what is now a more mature ecosystem with a wealth of value-oriented opportunities that are not dependent on GDP growth. Europe’s fragmented company landscape continues to offer strong consolidation opportunities across geographies and sectors to become European or global leaders. Coupled with attractive pricing based on Europe’s current relative lower valuation, the current environment makes for a compelling opportunity.
Private market entry EV/EBITDA*
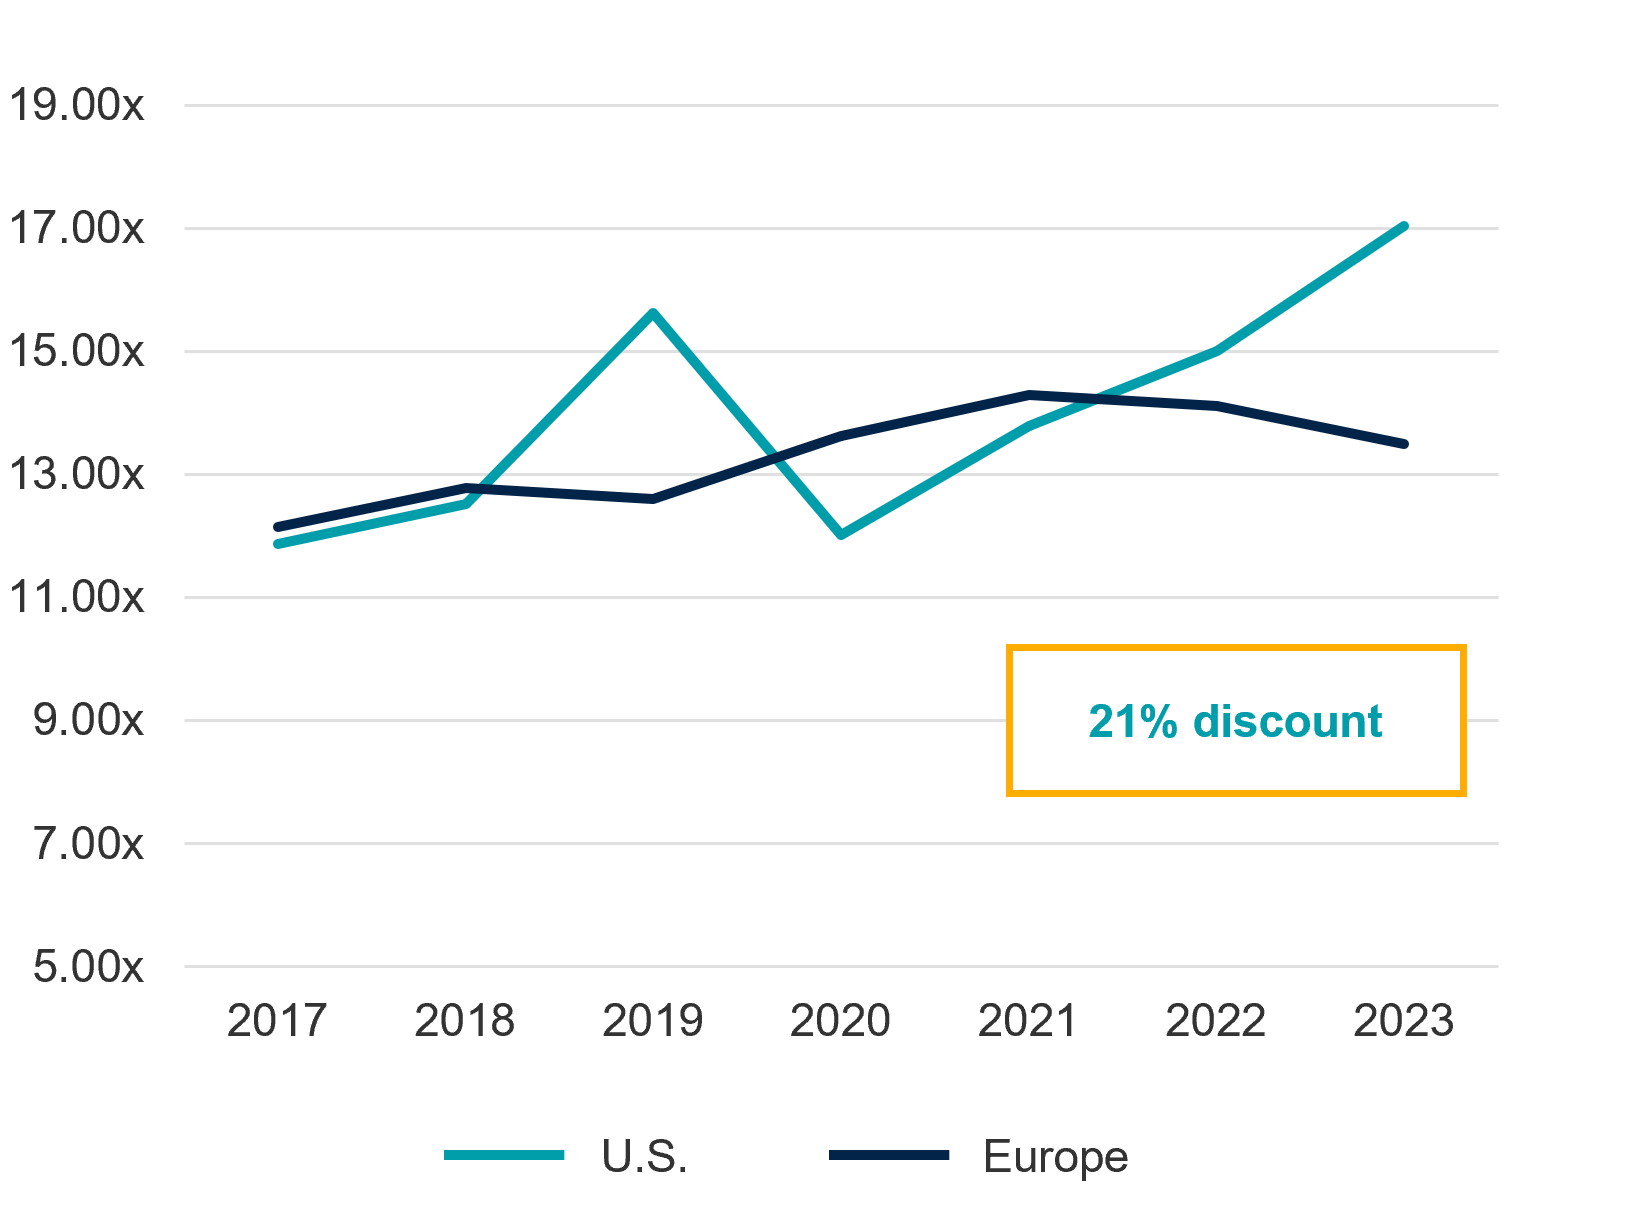
Europe / US relative discount
Buyout
| 2017 | 2018 | 2019 | 2020 | 2021 | 2022 | 2023 |
|---|---|---|---|---|---|---|
|
0.3x |
0.3x |
(3.0x) |
1.6x |
.05x |
(0.9x) |
(3.5x) |
*Median buyout entry multiple. | Source: PitchBook as of December 31, 2023.
APAC: A mosaic of markets
In the heterogenous Asia-Pacific region, individual country markets often move in an asynchronous manner. Over the last decade China, the largest economy in Asia-Pacific, has driven one third of private equity investments in Asia-Pacific. However, in the last 3-5 years, we have observed positive momentum in other growth markets such as India and Southeast Asia, as well as developed Asia (Japan, Australia, New Zealand, and South Korea) across fundraising, investments and exits.9 As a result, we saw Asia (ex-China) contribute to 80% of new investments and 81% of exit activity in 2023. In particular, India and Japan have become two active private equity markets in the recent three years, delivering compelling opportunities across the company building stages — from venture capital, to growth equity, and buyout.
Investment activity in Asia Pacific
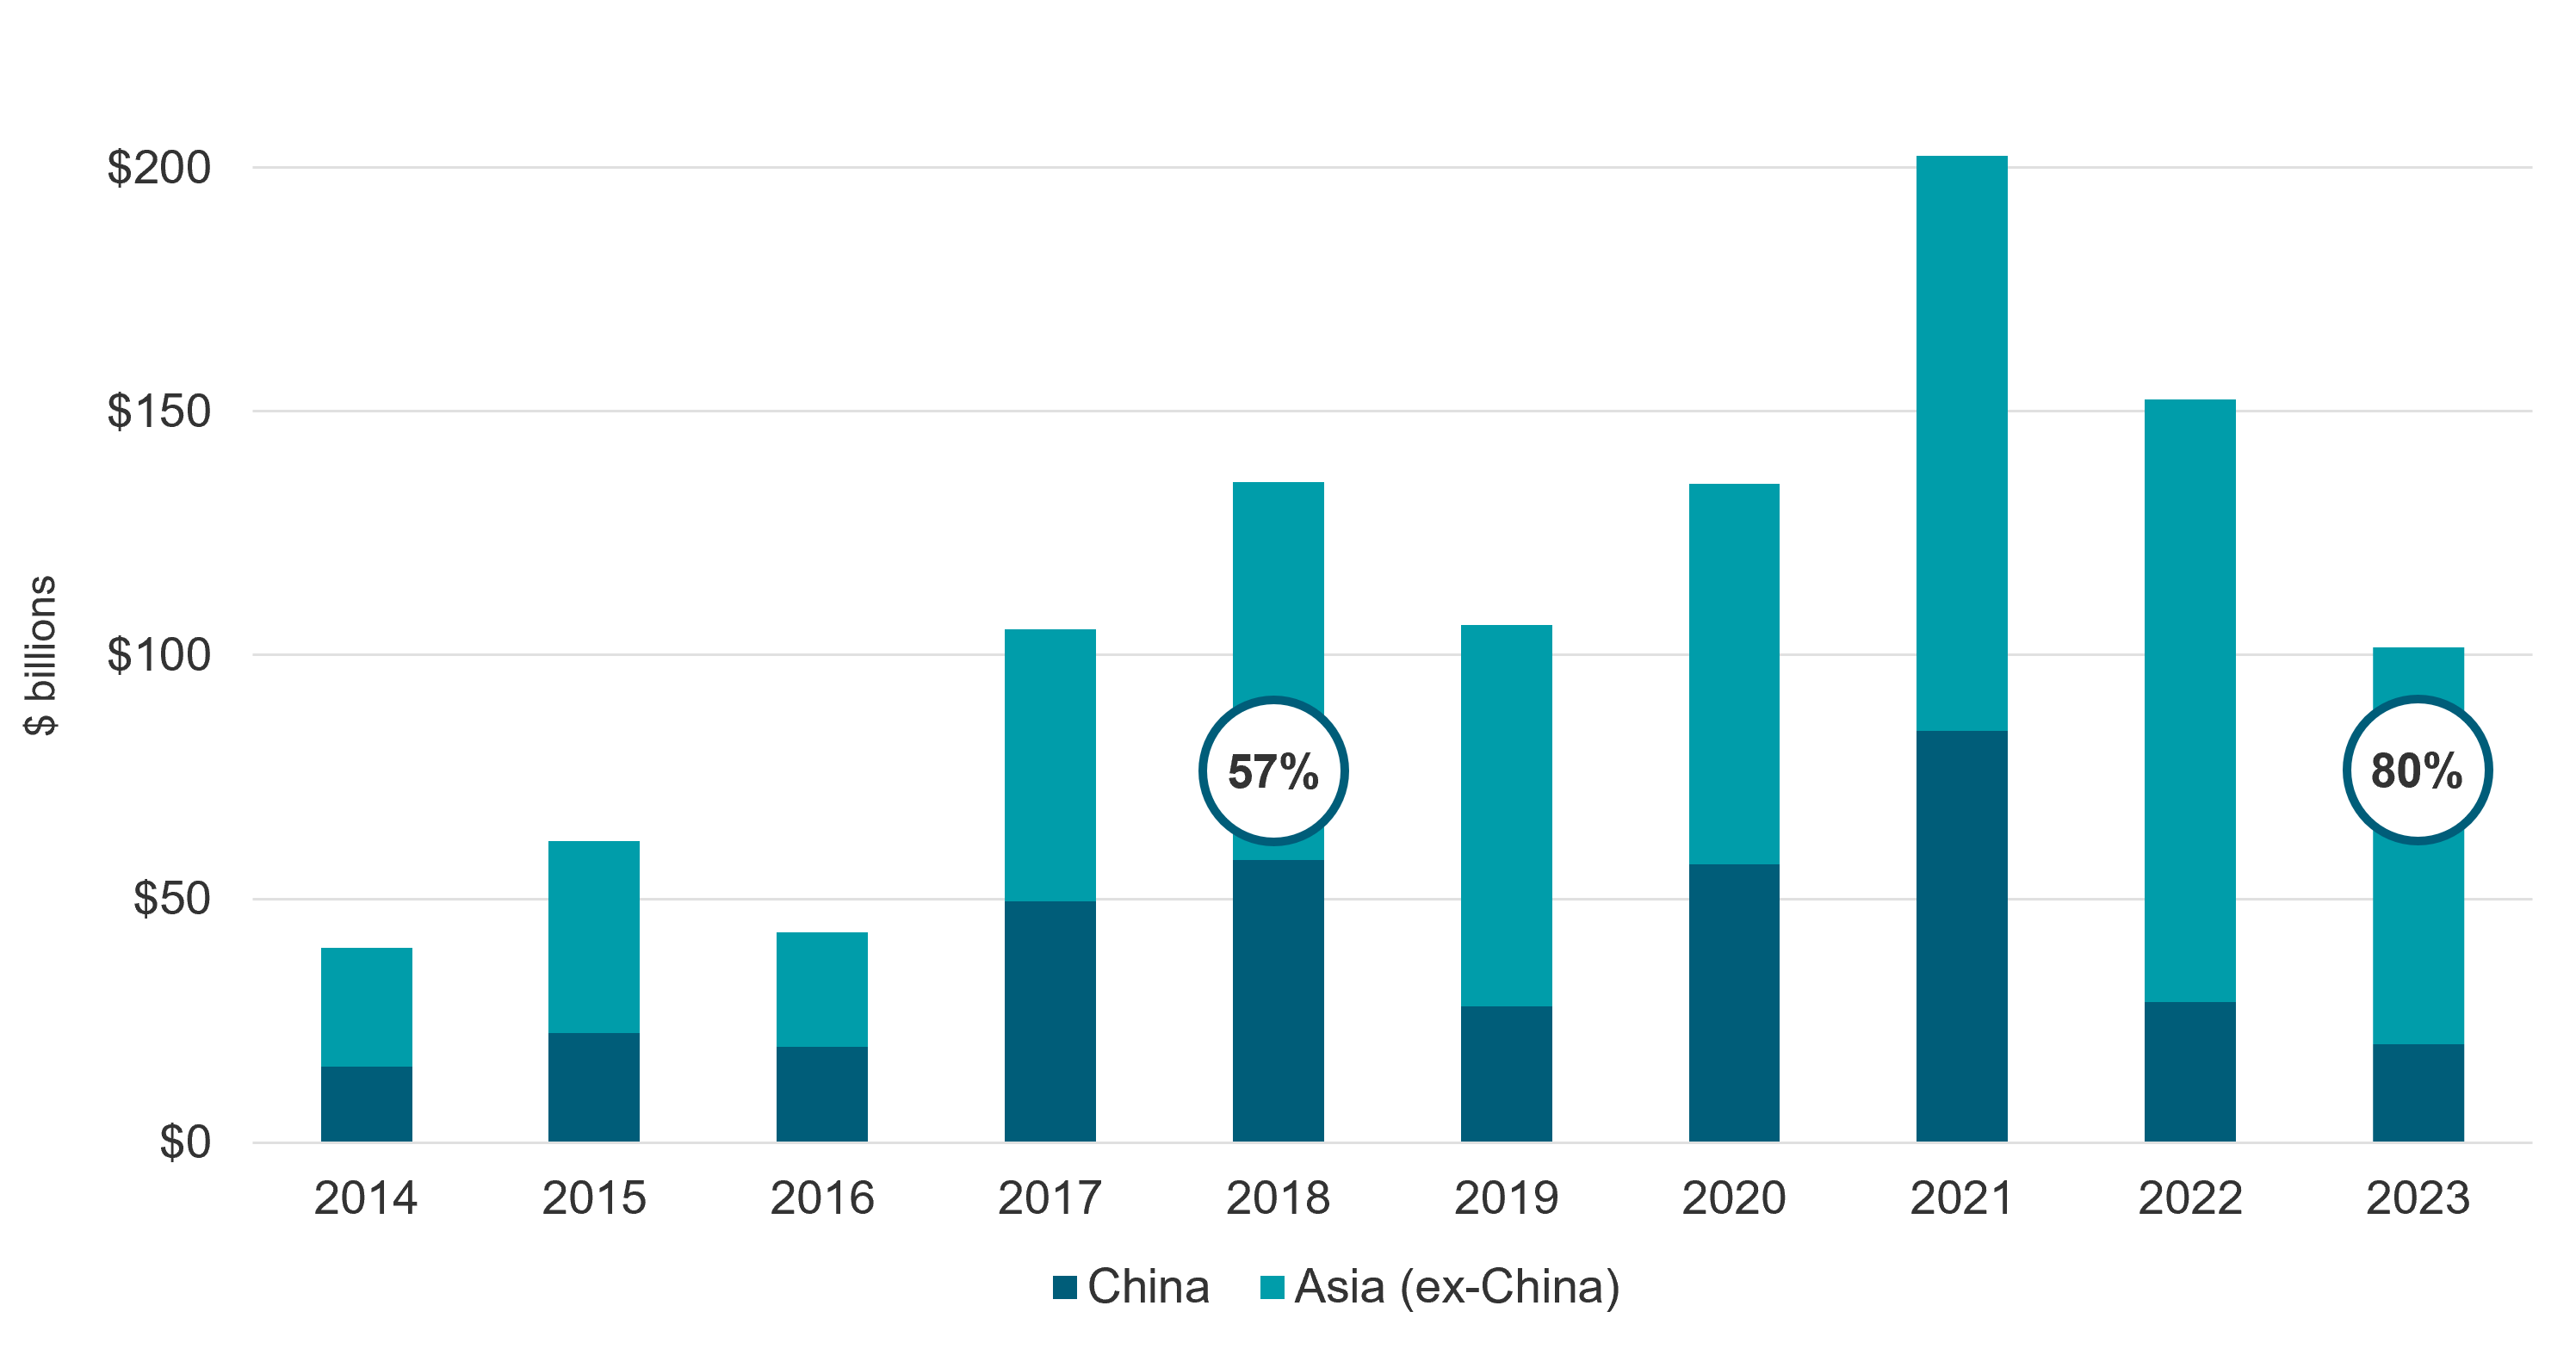
Note: % in circle refers to % contribution of Asia (ex-China) to investment activity in APAC in a given year
Looking forward, Asia Pacific’s macroeconomic cycle continues to provide attractive diversification benefits for global investors. We expect deal momentum to continue in the middle market across sector themes, including consumer, healthcare, and business and financial services. Liquidity profiles are improving for managers in India, Japan and Australia with a flurry of exits across three main routes: IPO, trade sales, and sponsor-to-sponsor activity. In India, for example, the number of IPOs in 2023 was the highest in the world, exceeding 2022 activity, and the 2024 pipeline looks strong.10 Meanwhile, larger pan-regional funds are pivoting away from China, boosting more sponsor interest for mid-market assets that are exit-ready.
25%
Three trends for 2024: Secondaries, infrastructure, and credit
Shifts in private markets activity have historically lagged those in public markets, and we do not expect the coming period to be an exception to this pattern. As the interest rate environment has levelled out and confidence has returned to public markets, we expect GPs to start turning their attention to dealmaking once more as we move through 2024. This trend will be supported by the fact that most GPs are well capitalized and that the dry powder they hold continues to age: in 2023, 26% of the $1.2 trillion of uninvested capital in the hands of buyout funds globally was at least four years’ old.11 Also unjamming the market are signs of more stable valuations, which should bring buyers and sellers closer together in price expectations than has been the case over the past 12-18 months.
Against this broader market backdrop, we believe three main trends will play out over the coming months and beyond.
1. Liquidity needs set secondaries on the path for a record year
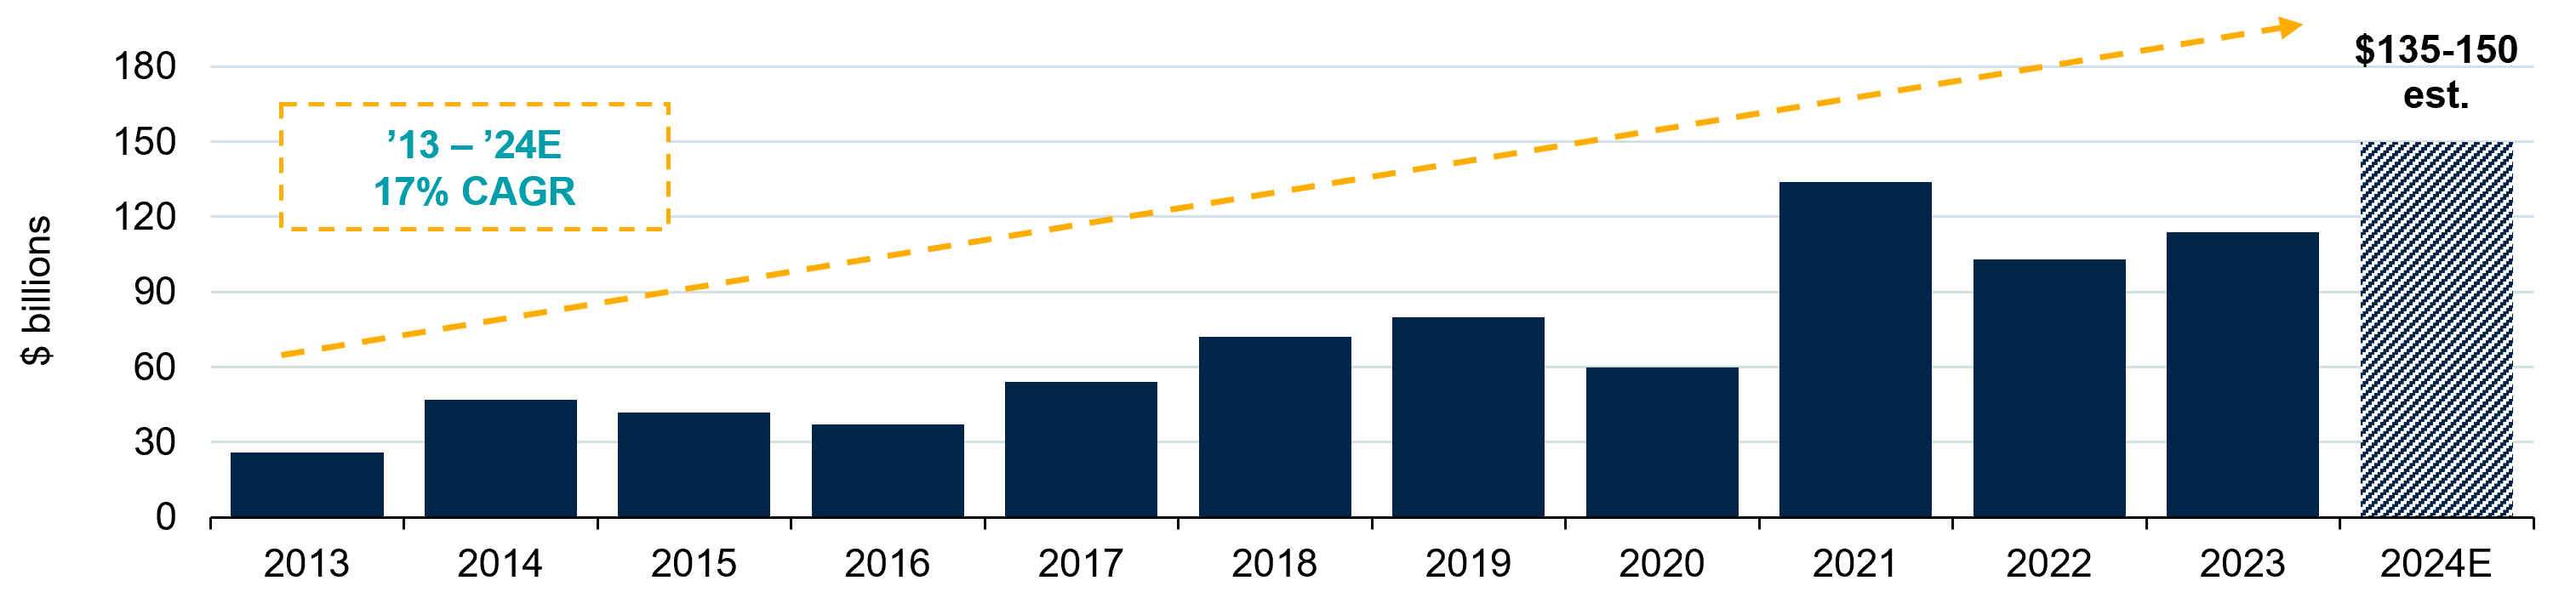
Nowhere is the theme of liquidity more pronounced than in the secondaries market. At the beginning of the year, we predicted robust secondaries market growth, and demand in 2024 appears strong buoyed by the growth of GP-led deals and the expansion of continuation vehicles. The challenging exit market over the past 18 months and the low level of distributions to LPs are creating expectations for a record 2024 in terms of transaction volume with estimates nearing $150 billion.12
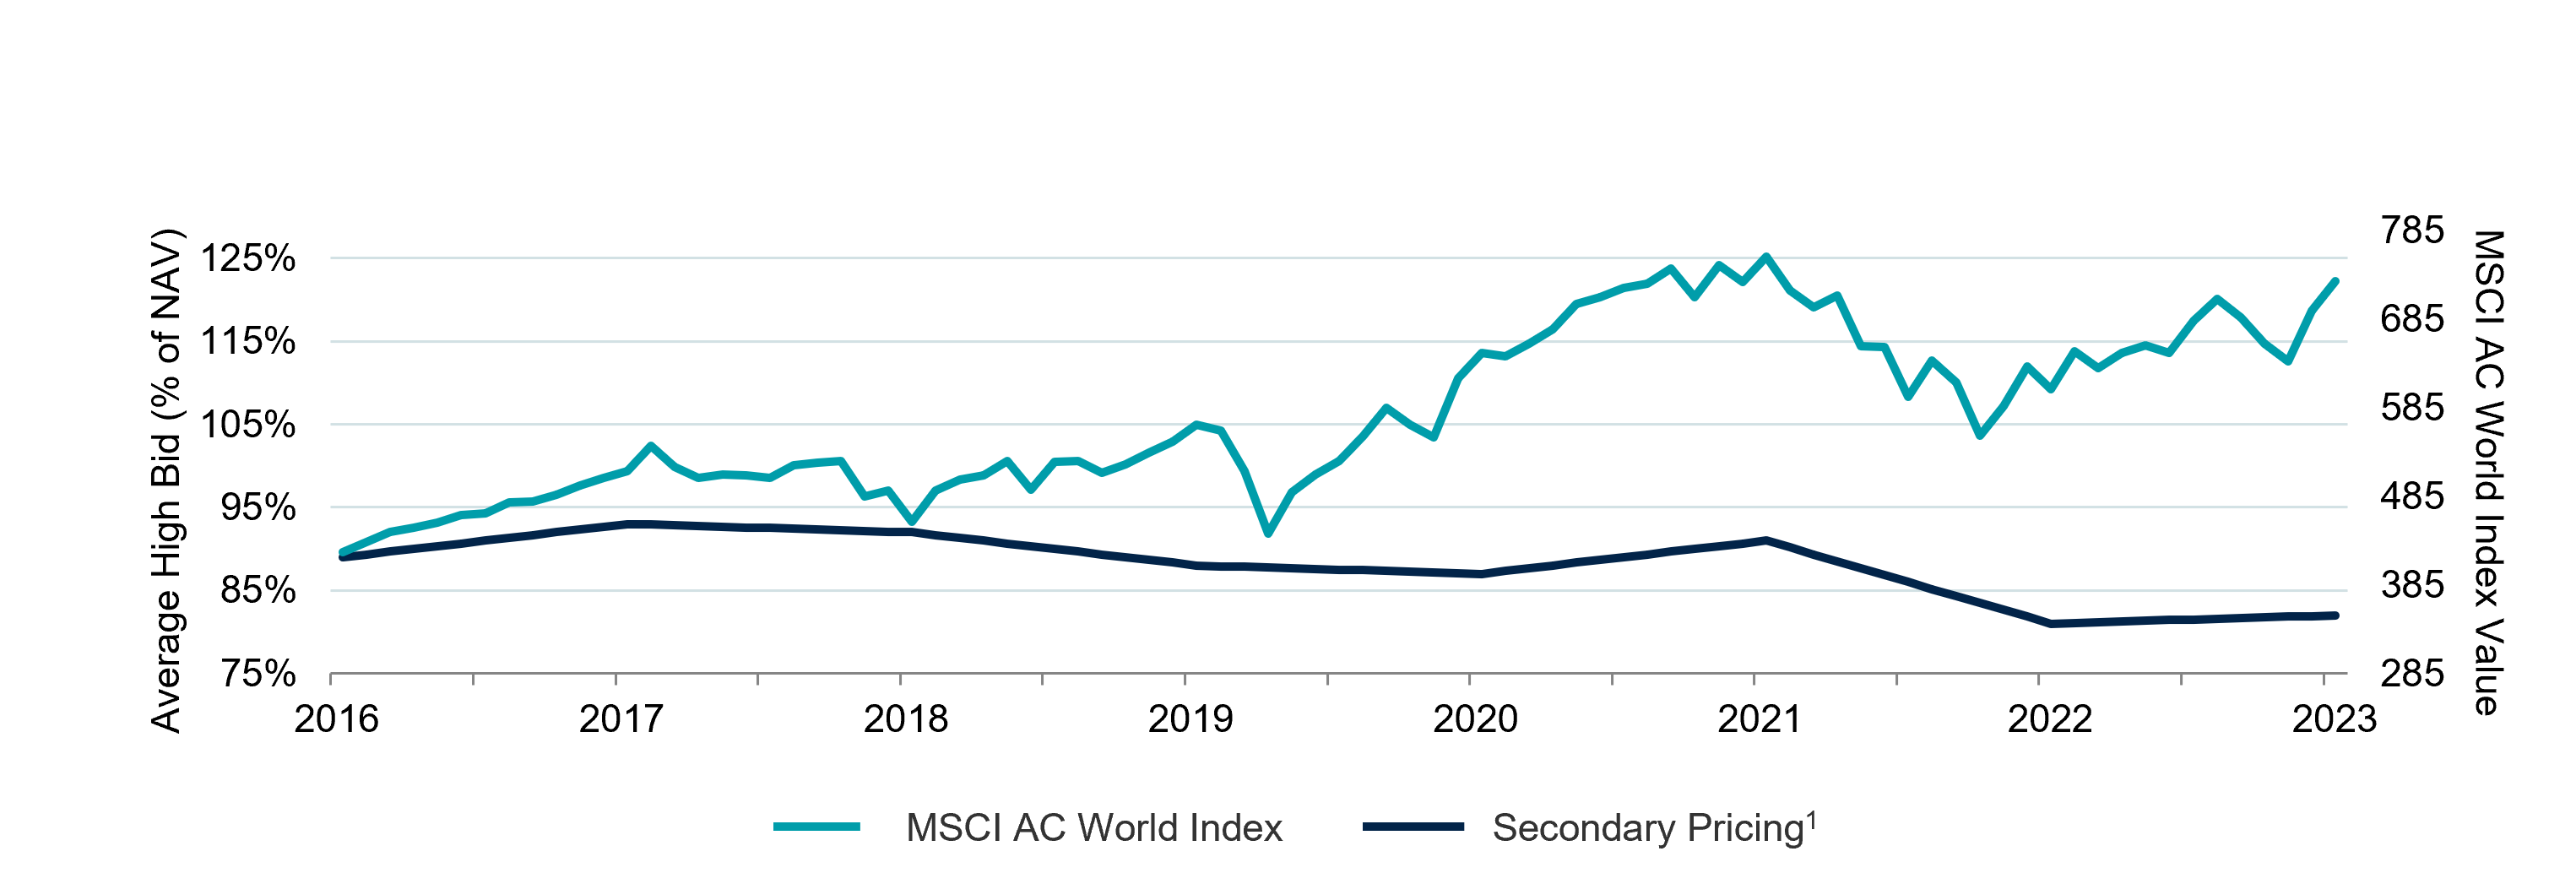
Pricing has tightened across the secondary market, but discount levels remain attractive relative to historical averages with high-quality buyout and growth equity assets often trading at double-digit discounts to NAV due to the market’s supply/demand imbalance. Secondaries remain undercapitalized, with less than two years of deal volume sitting in funds as dry powder — all of which is creating highly attractive opportunities for secondaries buyers with the capital, expertise, and resources to select the best quality assets.
Market highlights and key drivers
Record year for secondary transaction volume
Secondary market deal volume
Pricing remains highly attractive
PE secondary pricing vs. MSCI all country world index
As of December 31, 2023. Source: Evercore FY 2023 Secondary Market Survey Results (secondary data); 1 Source: Greenhill Cogent: Global Secondary Market Review (February 2024), Secondary Market Review (2006-2019)
Annual data represents 12-month average for each full year. Secondary pricing represents average high bid.
As traditional exit routes continue facing roadblocks in 2024, secondaries are gaining even greater appeal among GPs and LPs alike. GPs are embracing continuation vehicles to accelerate liquidity and DPI for their LPs, while holding on to high-quality assets for further value creation and better valuation and exit timing in the future. Others facing imminent fundraising, are also using GP-led deals to free up LP capital for commitment to successor funds, creating a win-win for the GP and LP. LPs are also continuing to transact in the secondaries market, but with the public markets rebound over recent months, these sellers are no longer solely motivated by over-allocation, but rather by liquidity and pacing considerations if they are to continue investing and diversifying across vintage years to optimize long-term risk-adjusted returns.
2. Secular trends continue driving infrastructure growth
In our full-year outlook, we predicted strong infrastructure investment growth. This growth was to be led by dual opportunities: core infrastructure’s stable, often inflation-adjusted revenues, and the more private equity-like offerings of climate and energy transition-related assets. As we sit half-way through the year, these trends are accelerating, in part as AI’s increasing adoption creates higher power and grid demands along with reimagined data center capacity.
While slower than the recent past, global investment in the energy transition sector continued growing over the more volatile past few years, rising to $1.77 trillion in 2023,13 with capital allocated across a wide range of segments beyond renewable energy. Investment in electrified transport overtook renewables in 2023, rising 36% over 2022 to reach $636 billion, while hydrogen investment tripled, carbon capture and storage nearly doubled, and energy storage increased by 76%. Bloomberg NEF estimates that investment levels will need to triple between now and 2030, to $4.84 billion a year, with further increases needed throughout the 2030s.14
At the same time, data center growth is fueling a rapid rise in energy demands as businesses increasingly adopt power-hungry AI tools. In 2022, data center electricity consumption accounted for 2.5% of US power usage, with an expectation that it triples to 7.5% by 2030.15 In the space of just a year, the five-year US nationwide forecast for electricity demand increased from 2.6% to 4.7%, with data center growth being one of the biggest contributors.16 A similar pattern is emerging across other global markets with the growing secular trend of digitalization.
Further, while renewable power purchase agreements with companies such as Amazon, Google, Meta and Microsoft for larger capacity data centers are creating attractive infrastructure opportunities, power grids and transmission will require much greater investment, particularly with the rising demands associated with AI. The total capacity of hyperscale data centers has doubled in the past four years, and a further doubling is expected by 2030.17
Hyperscale data centers
Data center growth
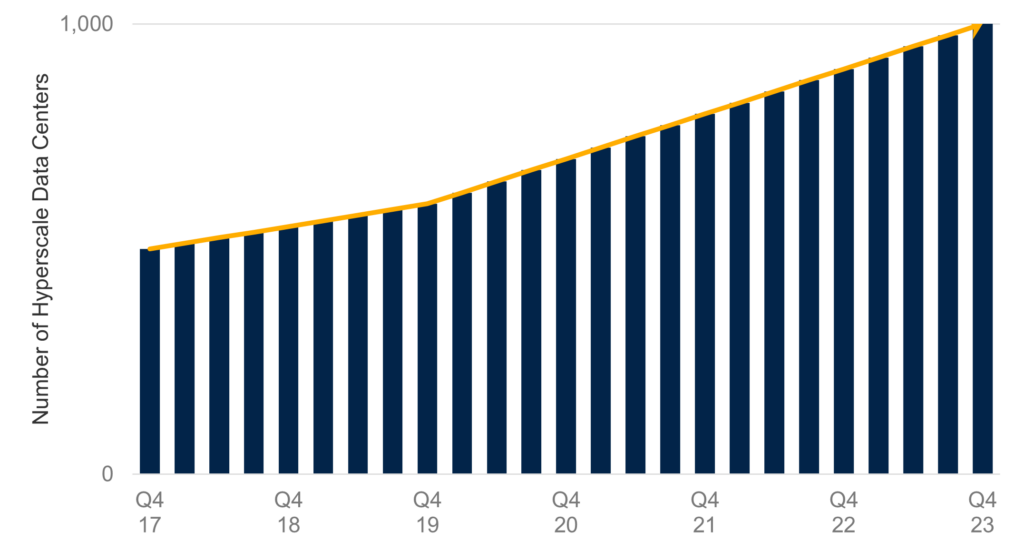
Data center capacity - Q4 2023
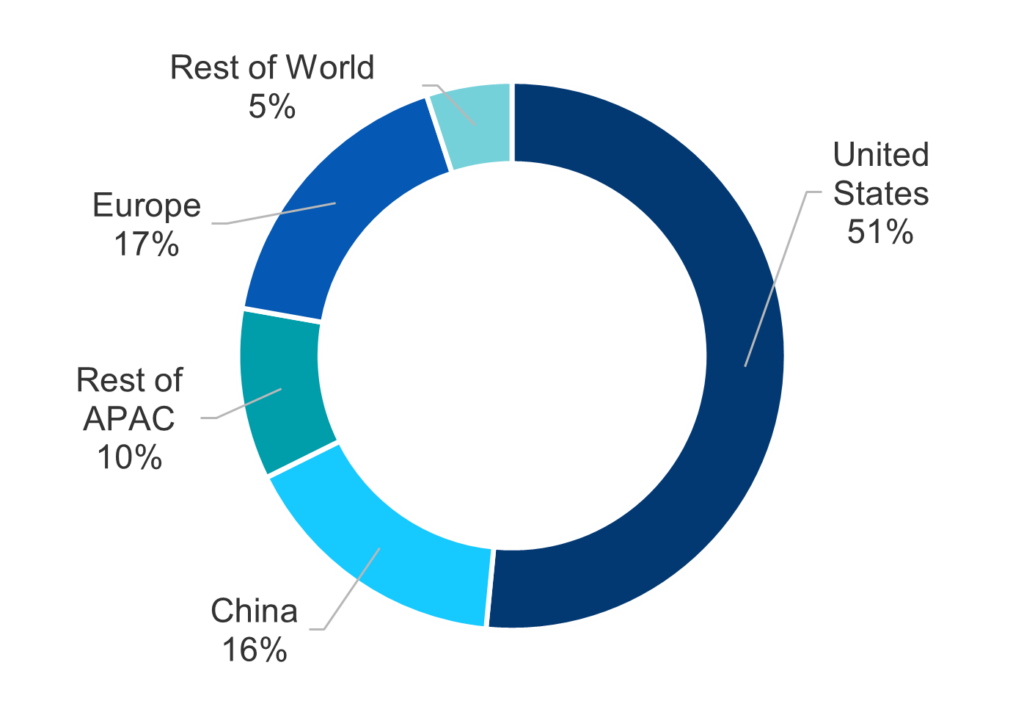
Source: Synergy Research Group.
3. Private credit continues to strengthen
As highlighted in our full-year outlook, private credit has demonstrated resilience though the pandemic, supply chain issues, and interest rate rises, with direct lending recording lower default rates than the broadly syndicated loan or high yield bond markets. And when defaults do occur, senior private credit has a higher recovery rate. These differences still hold true and, when combined with direct lending’s outperformance versus public markets, it is clear why the asset class holds investor appeal. Indeed, private credit AUM is forecast to grow at a CAGR of 11% from $1.5 trillion in 2022 to a record $2.8 trillion in 2028.18
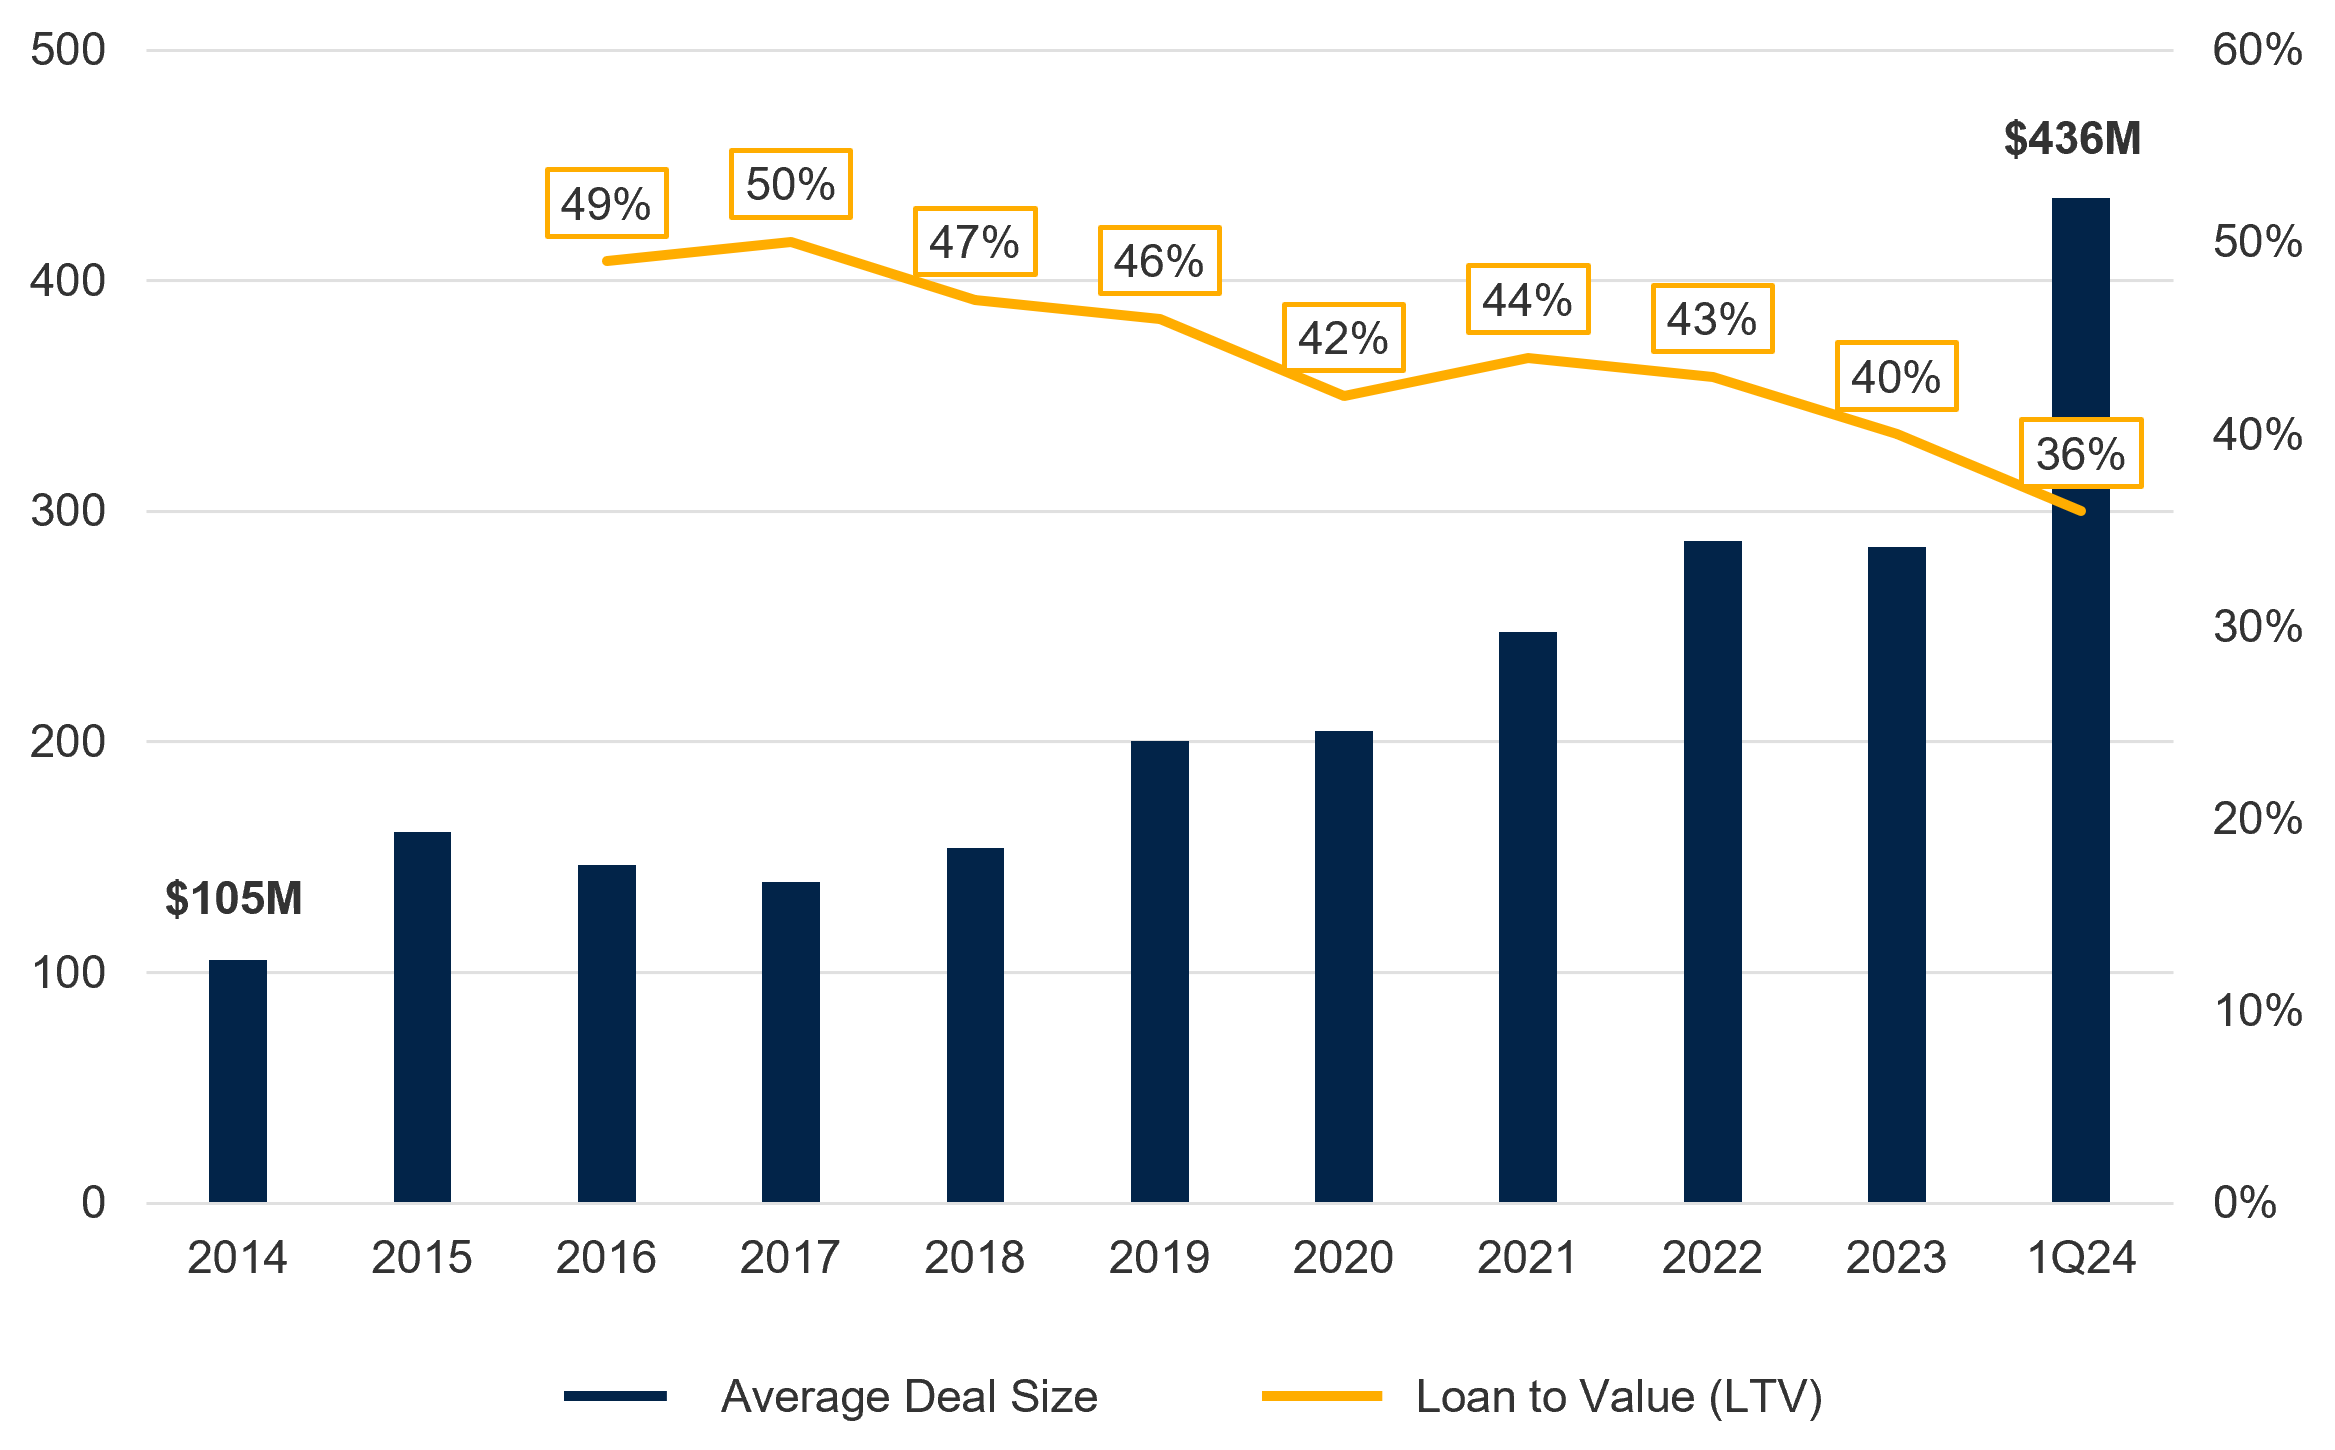
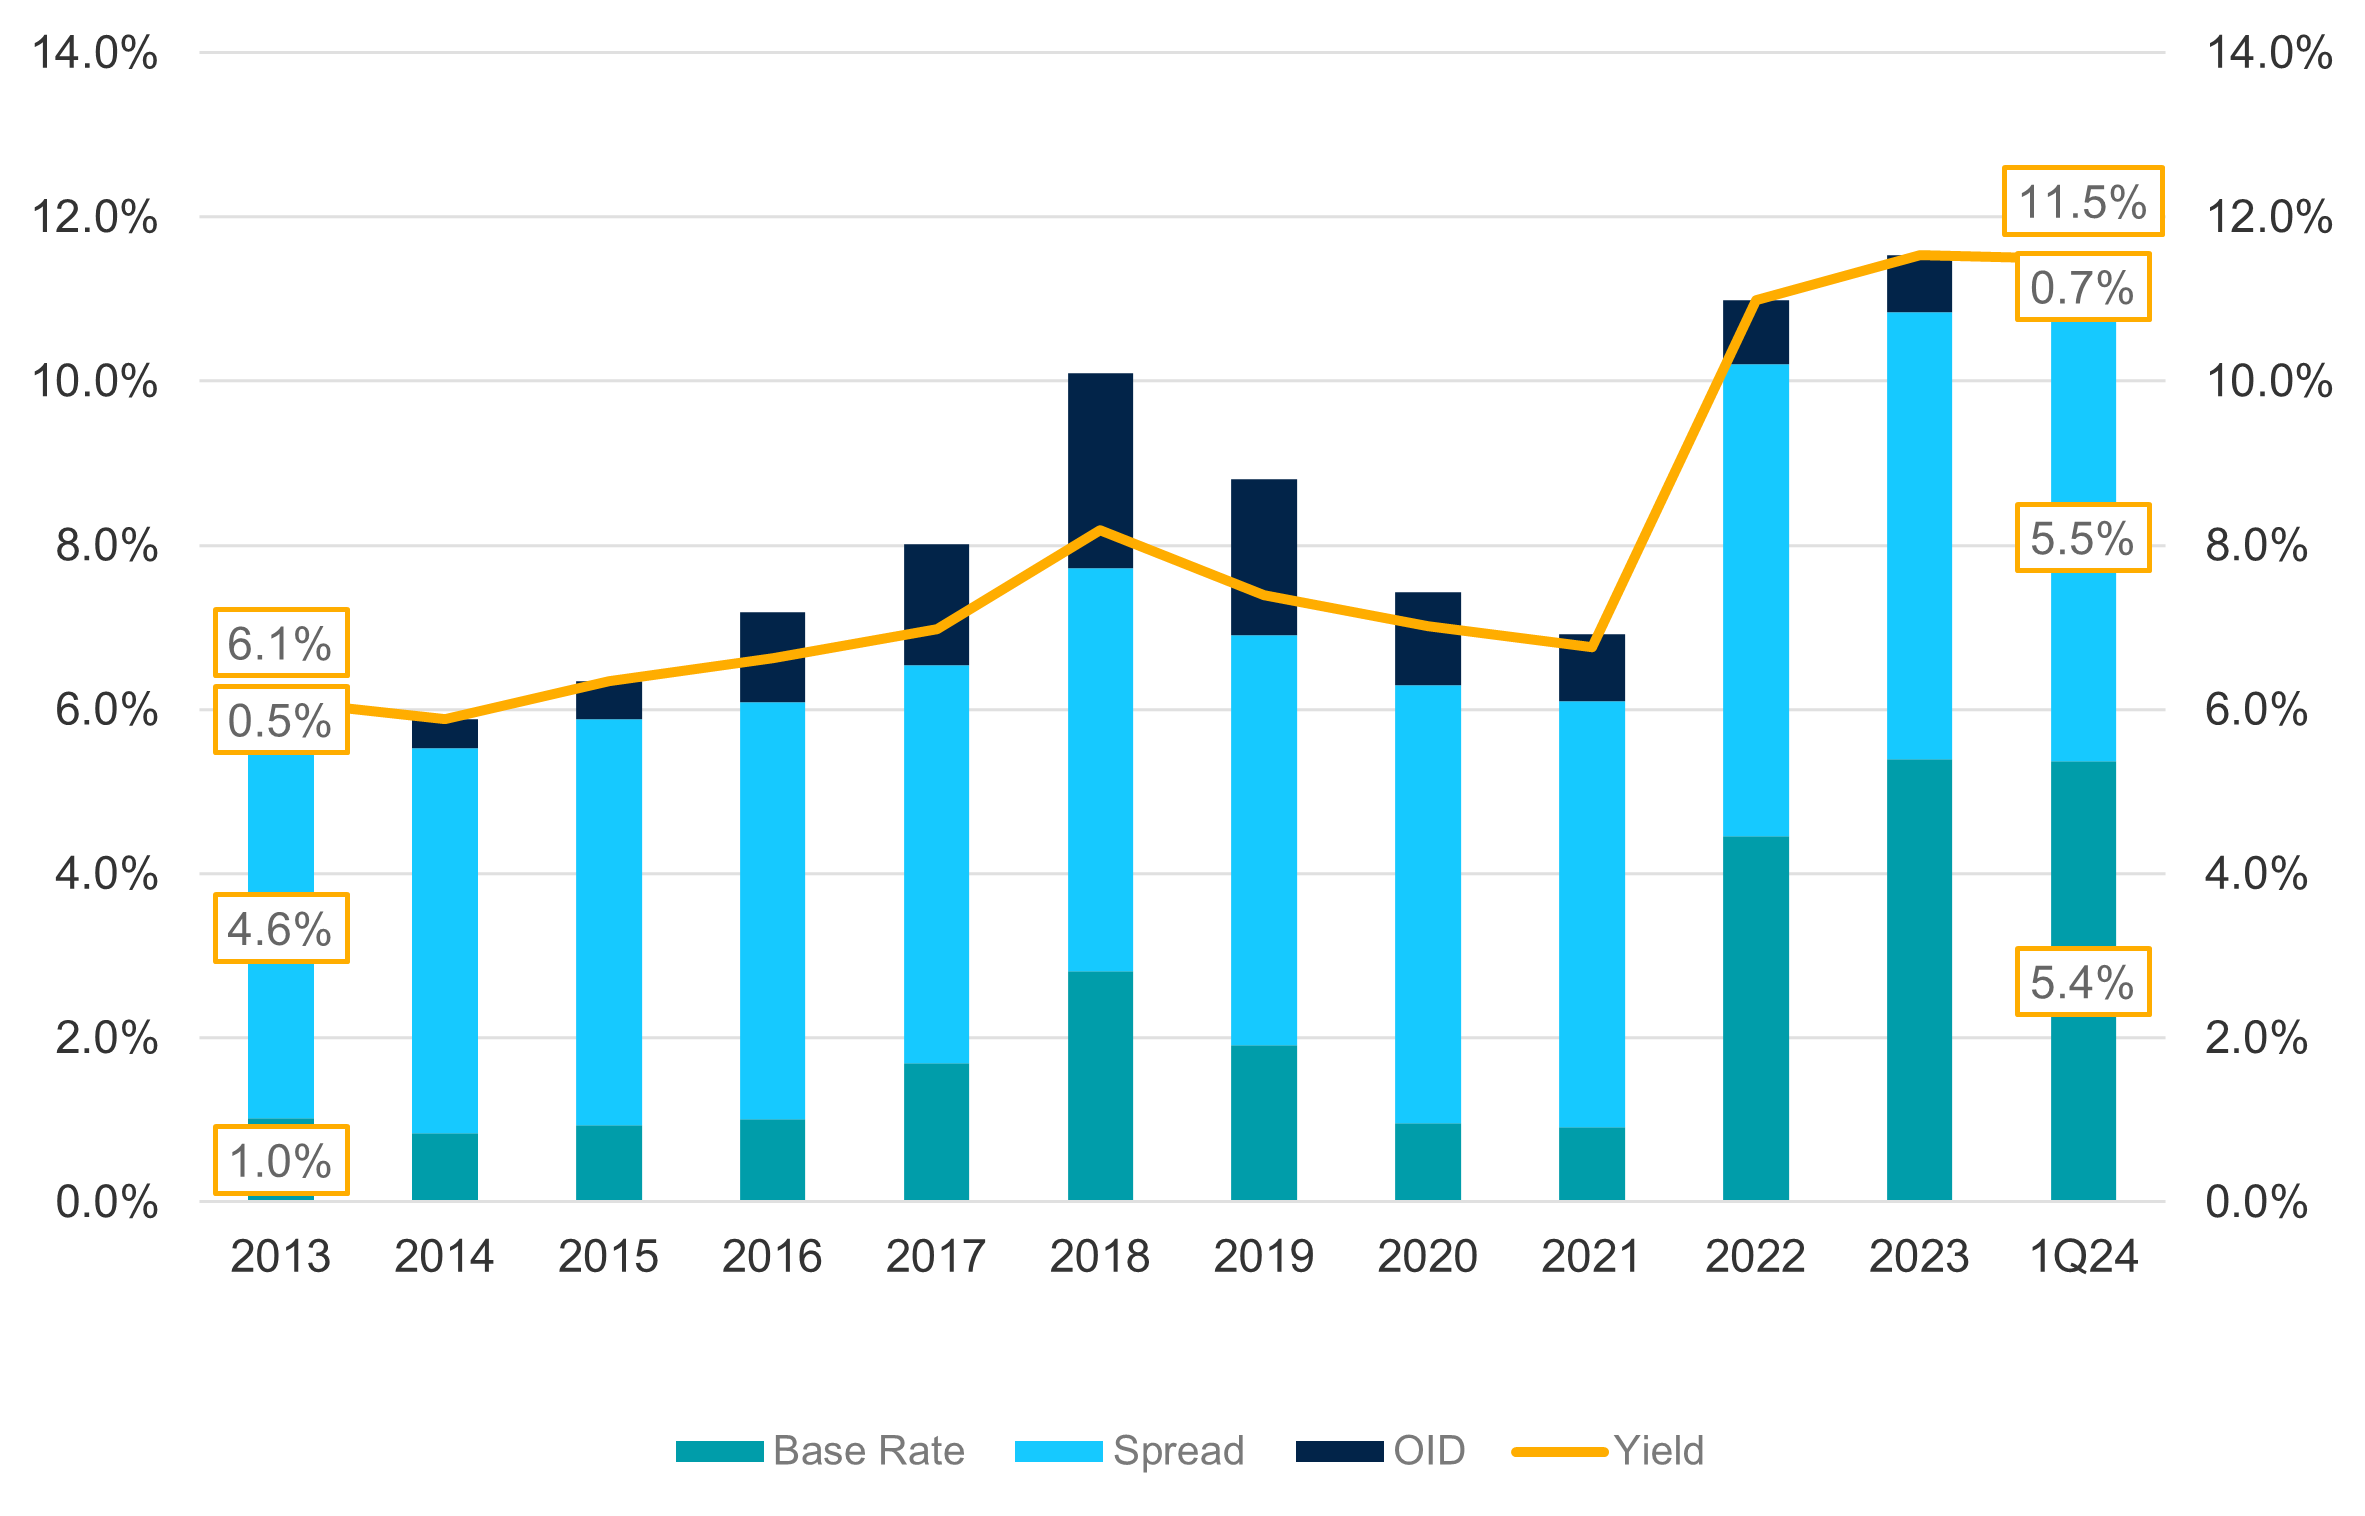
Higher for longer rates and strong fundamentals underpin continuing demand for private credit investing. As interest rates in Europe and North America remain high, direct lending’s primarily floating rate structure continues to offer investors protection and strong returns, while the potential investment pool has broadened to include larger middle-market companies. Since 2014, the average middle-market private credit deal has increased from $100 million to $400 million and loan to value (LTV) has declined from 49% to 36%. The direct lending deals we are seeing in 2024 involve higher quality businesses and have larger equity cushions than ever before. At the same time, yields are at a record high — doubling from 6.1% in 2013 to 11.5% for senior credit.19
Direct lending today finances increasingly high-quality businesses at record levels of returns
Company size has increased while LTV has declined...
...despite record high yields
Sources: Refinitiv and Bloomberg.
Chart (left): Avg. deal size and Loan to value sourced Refinitiv; represented by first quarter trailing 7 calendar years as of Q124.
Chart (right): Direct Lending Term Loan Spread sourced from Refinitiv; SOFR (or LIBOR) base rates sourced from Bloomberg.
The junior credit market has also evolved, moving from primarily mezzanine in the early days to second lien and now to PIK preferred securities, offering investors several potential structural benefits. Similar to the senior credit market, junior credit is also seeing lower LTV, falling from a peak of 54% to an average of 41% in 2024, while coupons have increased notably. Today’s junior credit market offers investors the potential for equity-like returns, with all in-yields between 14-17%, with better downside protection and valuation risk than the equity market.
25%
Flowing in the right direction
Private markets are agile and adept at finding opportunity in dislocation, yet they are not immune to macro shocks. Higher interest rates in North America and Europe, combined with geopolitical tensions and the 2022 public markets correction, have affected activity levels over the past 18 months, with an inevitable knock-on effect to liquidity. 2023 proved to be a year where private markets reset and now appear to be moving forward under renewed terms.
There remain risks in the system, with geopolitics and global elections presenting notable uncertainties in 2024 — but signs point to the frozen pipes of 2023 thawing. Secondaries and innovations in liquidity are getting capital flowing once more and confidence is slowly returning to the M&A and IPO markets. And while a lack of ready liquidity will continue to drive activity, for those with capital to invest, the coming private market cycle offers the potential for strong returns. Necessity is often the mother of invention, and we are confident that today’s challenges will result in further innovation and value creation as private markets deploy entrepreneurial talent and innovation to transform challenges into opportunities.
Would you like to discuss our investment strategies for 2024?
Footnotes
- https://www.imf.org/en/Publications/WEO/Issues/2024/04/16/world-economic-outlook-april-2024
- https://www.spglobal.com/spdji/en/indices/equity/sp-500/#overview
- https://www.msci.com/documents/10199/178e6643-6ae6-47b9-82be-e1fc565ededb
- S&P Q1’24 M&A and Equity Offerings Market Report
- https://pitchbook.com/news/reports/q1-2024-us-pe-breakdown
- https://pitchbook.com/news/reports/q1-2024-us-pe-breakdown
- Invest Europe, based on Cambridge Associates. https://www.investeurope.eu/news/opinion/don-t-miss-the-middle-the-outperformance-of-mid-market-european-private-equity/
- https://pitchbook.com/news/reports/q1-2024-european-venture-report
- Investment and exit activity across APAC based on data from AVCJ, APER, supplemented by HarbourVest analysis of other activity in the market, as of March 31, 2024, excludes investments by sovereign wealth funds, RMB funds and other non-PE financial investors.
- https://www.ey.com/en_in/news/2024/02/indian-stock-exchanges-rank-first-in-the-world-in-terms-of-the-number-of-ipo-in-2023
- https://www.bain.com/insights/topics/global-private-equity-report/
- HarbourVest figures.
- Energy Transition Investment Trends 2024, Bloomberg NEF
- https://about.bnef.com/blog/global-clean-energy-investment-jumps-17-hits-1-8-trillion-in-2023-according-to-bloombergnef-report/
- https://www.linkedin.com/pulse/impact-genai-electricity-how-fueling-data-center-boom-vivian-lee/
- The Era of Flat Power Demand is Over, Grid Strategies, December 2023
- https://www.srgresearch.com/articles/hyperscale-data-centers-hit-the-thousand-mark-total-capacity-is-doubling-every-four-years#:~:text=New%20data%20from%20Synergy%20Research,thousand%20mark%20in%20early%202024
- https://www.preqin.com/news/rate-hikes-bolster-private-credits-allure-in-2023-but-weigh-on-most-other-private-assets
- Refinitiv, as of March 31, 2024.
Disclosure
HarbourVest Partners, LLC is a registered investment adviser under the Investment Advisers Act of 1940. This material is solely for informational purposes and should not be viewed as a current or past recommendation or an offer to sell or the solicitation to buy securities or adopt any investment strategy. The opinions expressed herein represent the current, good faith views of the author(s) at the time of publication, are not definitive investment advice, and should not be relied upon as such. This material has been developed internally and/or obtained from sources believed to be reliable; however, HarbourVest does not guarantee the accuracy, adequacy or completeness of such information. There is no assurance that any events or projections will occur, and outcomes may be significantly different than the opinions shown here. This information, including any projections concerning financial market performance, is based on current market conditions, which will fluctuate and may be superseded by subsequent market events or for other reasons. The information contained herein must be kept strictly confidential and may not be reproduced or redistributed in any format without the express written approval of HarbourVest.