Search

Search
 Strategy insights​

The Attribution Advantage:

Improving manager analysis in private markets

December 18, 2024 | 7 min read

As investors contemplate how best to maximize future returns and optimize portfolio construction, they look to invest with who they believe are the best possible managers with the hopes that prior alpha and outperformance can be sustained. Traditional tools for track record analysis provide little transparency into how a GP has generated returns and limited insight into whether returns will persist. Particularly in today’s era of elevated interest rates and lower growth expectations amidst less liquidity, this exercise takes on added importance. In this piece, we explain one way in which we have successfully adapted techniques from public markets to build advanced analytical tools for private markets — specifically, how our “Manager Alpha” attribution tool uses our deal-level indexes to evaluate GP performance in ways that can help investors separate manager skill from luck. 

Toward a methodology for quantifying GP Alpha

The focus for most investors is how to identify the top quartile managers of the future. Significant dispersion of returns in private equity means that investors have the potential for alpha generation, provided they can proactively identify top-performing managers. However, track record evaluation and benchmarking has been a fraught exercise given challenges in identifying fair comparisons of peer groups, vintages, and performance metrics.1 Market conditions can exacerbate these challenges. Track record evaluation has been further complicated in the prolonged period of excess liquidity following the Global Financial Crisis (GFC), where generally upward trending markets, expanding valuation multiples, and concentrated outperformance of certain sectors (e.g., software) could be either a tailwind or a headwind to a GP’s return. Reliably forecasting alpha based on knowable information has, if anything, been persistently elusive for investors.2

Recognizing these limitations, and the importance of solving them not just for our own clients but for private markets more broadly, our Quantitative Investment Science (QIS) team developed methods of identifying manager alpha through attribution analysis. Also known as performance attribution or return attribution, attribution analysis compares the returns of a specific portfolio, or specific parts of a portfolio, against a benchmark.3 By comparing performance to a benchmark, attribution analysis seeks to identify the source of a manager’s returns and provides an objective, quantifiable analysis of a wide range of portfolio performance metrics to separate skill (sector allocation or deal selection) from luck (market returns).

Foundational to our approach are our proprietary deal-level indexes that leverage our extensive dataset, which includes 70,000+ deals across 45+ vintages.4 Deal-level benchmarking creates a representative opportunity set of private equity transactions with full transparency and cash flow history, enabling more granular insights than provided by public market indexes or private equity partnership-level indexes. Specifically, it allows for precise sector and geography benchmarking, both of which influence GP performance and are obfuscated in traditional fund-level benchmarks.

Our attribution model applies these indexes in efforts of determining a manager’s added value at the deal level. This combination seeks to generate insights that shed light on whether a manager has generated alpha, the sources of that alpha, and the quality and potential repeatability of that alpha going forward.

Moreover, we believe that as innovations like this take hold, investors will be able to ask and answer a broad range of new questions. Some of these questions include:

  • What has been the magnitude of excess value generated by a GP?
  • How does a GP’s excess value compare relative to a calibrated peer group?
  • What have been the sources of excess value?
  • What has been the quality of a GP’s excess value?
  • What has been the trend of a GP’s excess value?

To make these concepts more concrete, we will present two case studies to illuminate how GP Alpha analysis can be used to answer these critical questions.

David Butts, PhD

Principal, QIS

Julia Hanmer

Vice President, QIS

Eric Simas

Managing Director, Primary

Case study 1: A GP who looks strong on traditional quartile metrics but weak on excess value metrics

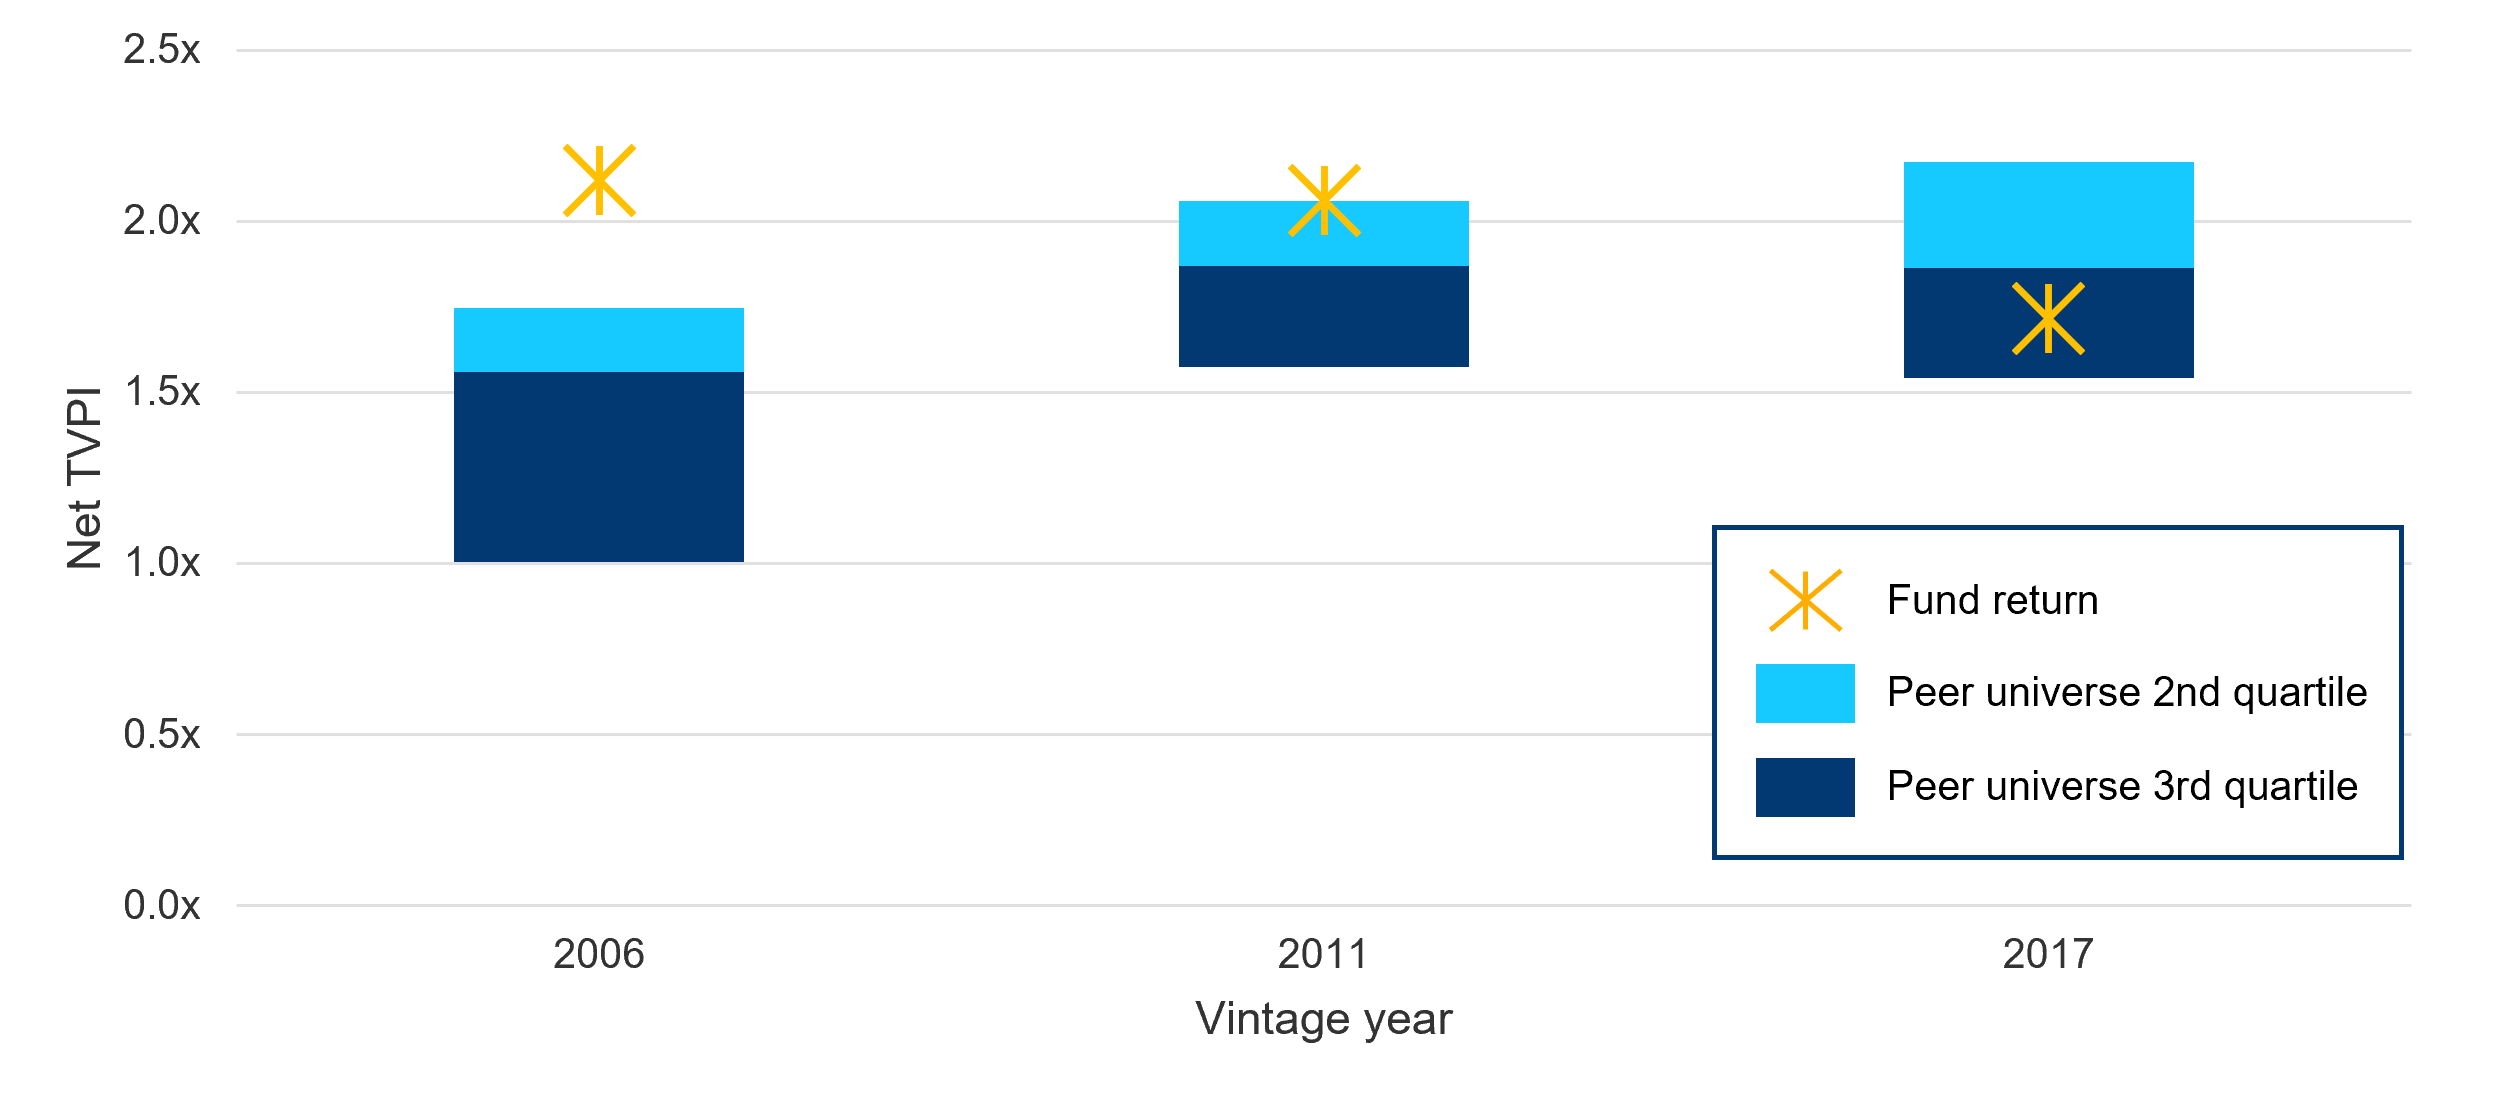
Our first case study illustrates how the model can be a useful tool to evaluate whether to re-up with an incumbent GP or to consider a potential replacement. In this example, so-called “GP A” is a European middle market buyout manager who consistently ranks in the top quartile of traditional performance metrics.5 When measured on underlying deal returns, GP A had similar gross TV/TC performance relative to a competitive cohort of incumbent European middle market GPs with similar focus — making them appear to be a strong performer potentially worthy of consideration.

GP A fund return quartile versus peer universe for prior 3 vintages

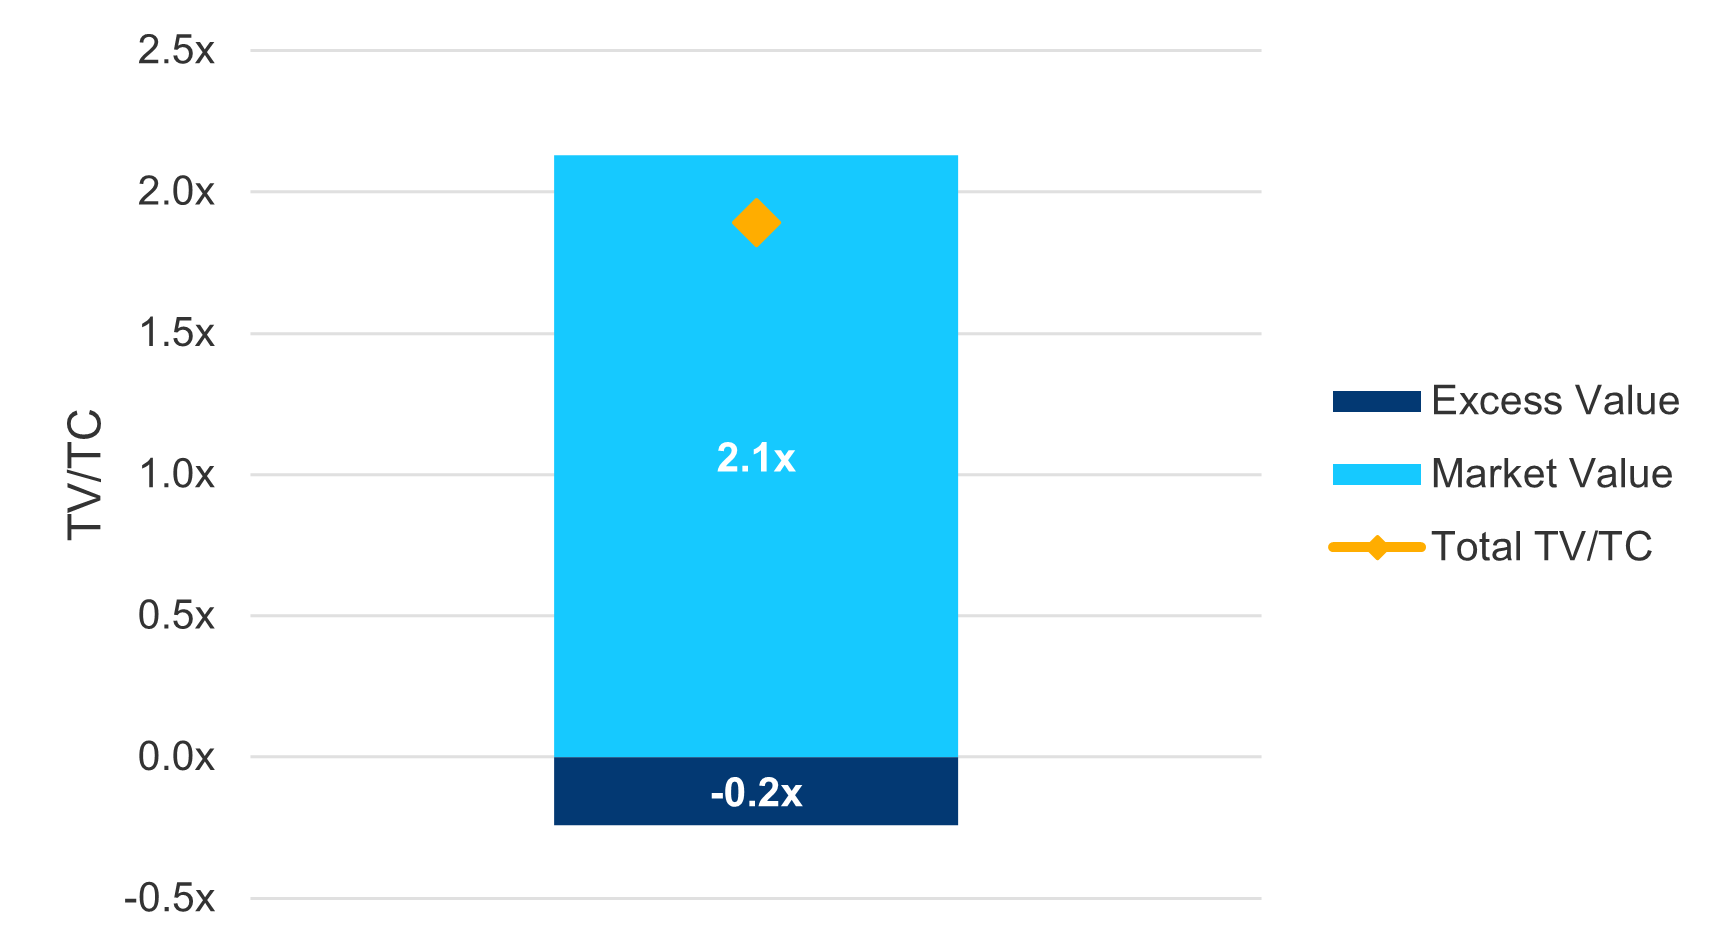
GP A track record decomposition

Source: HarbourVest

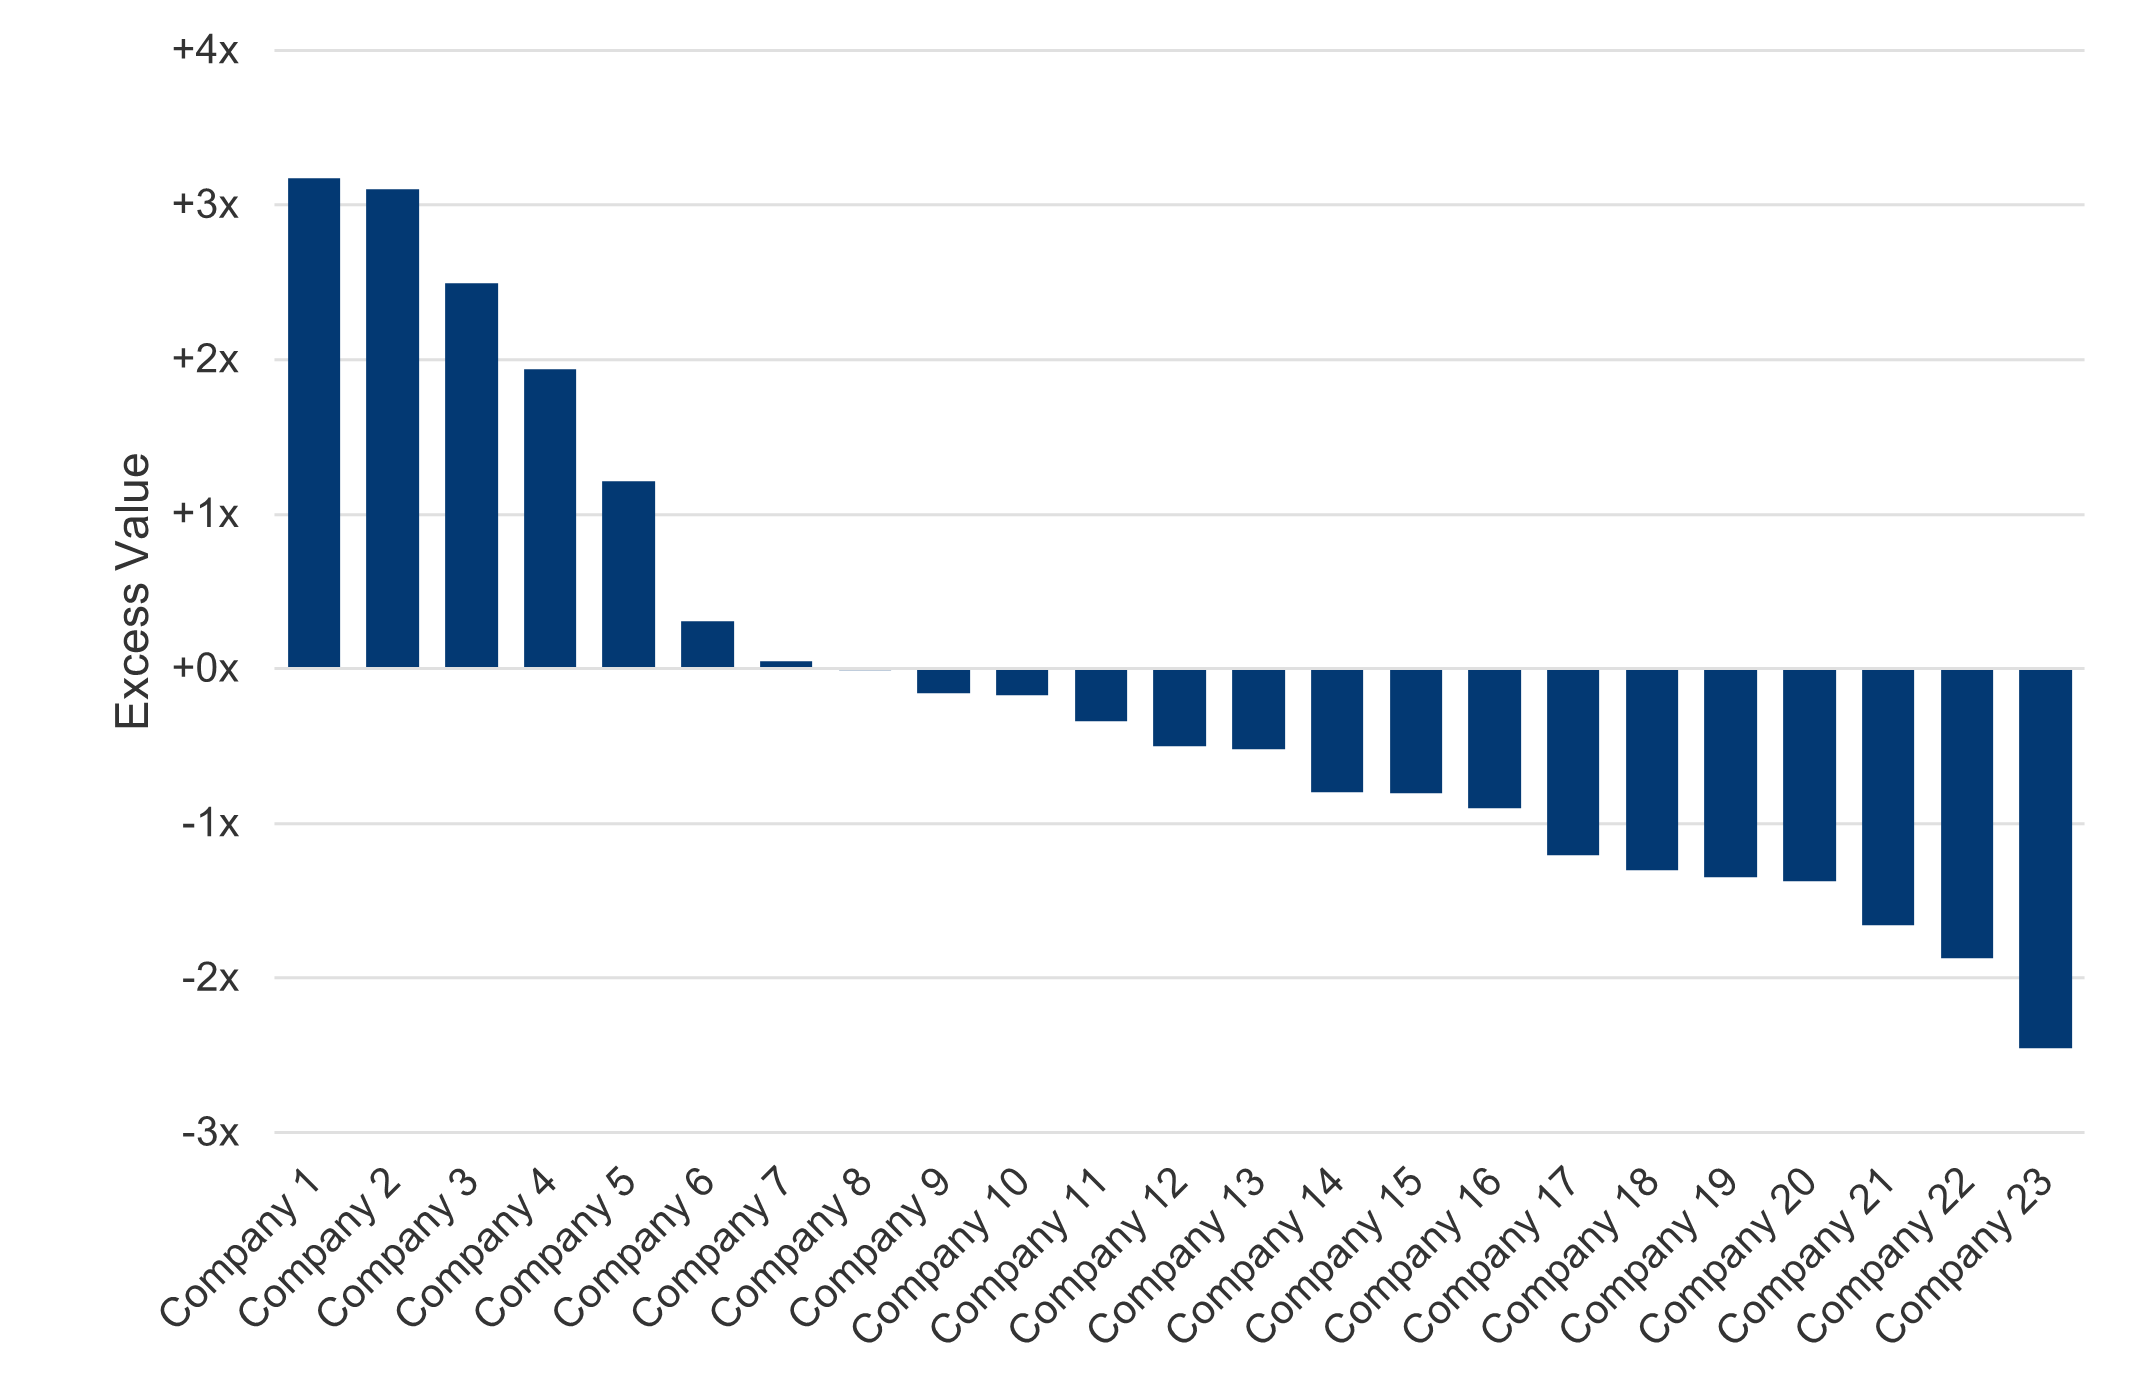
However, when GP A’s track record was decomposed between market return and excess value, it became clear that the manager disproportionately benefited from having made investments in strong market environments with little value from selecting above average deals. In the image above, this is reflected in the positive market multiple shown in blue, and negative excess value shown in dark blue. Further exploration utilizing the excess value framework revealed that GP A was relatively weak in selecting deals due to a low hit rate of selecting companies with positive excess value, a reliance on a handful of extreme outlier deals, and relatively high loss ratios. This perspective from our GP Alpha tool complemented a broader assessment and allowed us to quantify our intuition that the GP’s seemingly strong performance was unsustainable and unlikely to persist. Given this, in this instance we declined to invest in their next fund. In the context of investing, decisions not to invest are just as important as decisions to invest.

GP A excess value by
realized investment (2011-2020)

Key Metrics
Hit rate (count)
42%
Hit rate (cost)
32%
Loss ratio
14%

Key Metrics Definitions:

Hit Rate (count): Hit rate is defined as the frequency of deals in the track record that outperformed the market benchmark during their hold period, either by equally weighted (count) or cost-weighted. This is the number of deals with Holding Excess > 0 (i.e., deal beat the market benchmark during its hold period) divided by the number of deals in the track record.

Hit Rate (cost): Hit rate (cost) is the Total Cost (TC) of deals with Holding Excess > 0 divided by the aggregate TC of the track record.

Loss Ratio: Loss ratio is the aggregate loss in deals that are unrealized but impaired and deals realized below cost divided by total capital invested. This is Total Cost (TC)  Total Value (TV) for deals with TV<TC (i.e., total loss in deals held below cost) divided by the aggregate TC of the track record.

Case study 2: How to identify skill amongst specialist GPs

Over the last decade, technology has been the dominant sector with an industry-leading average of 3.2x gross multiple on invested capital (MOIC) from realized buyout deals invested between 2012-2021.6 During this boom cycle, technology investments have also attracted substantial new investment, increasing the likelihood of portfolio imbalances. Conversely, GP performance can appear mediocre by traditional metrics if they specialize in an out-of-favor sector while having substantial value from portfolio diversification and selection standpoints. We bring this dynamic to life with two recent examples.  

By comparing two GPs who predominantly invest in technology and have realized similar attractive gross multiples of 2.7-2.9x, the difference in GP performance becomes clear. As you can see in the below chart, GP B has generated more than all of their excess returns from allocating to a hot sector, while GP C has benefited less from the sector effect. Instead, their returns are due to greater skill in deal selection. One had persistent luck, another persistent skill. 

GP B

GP C

Source: HarbourVest

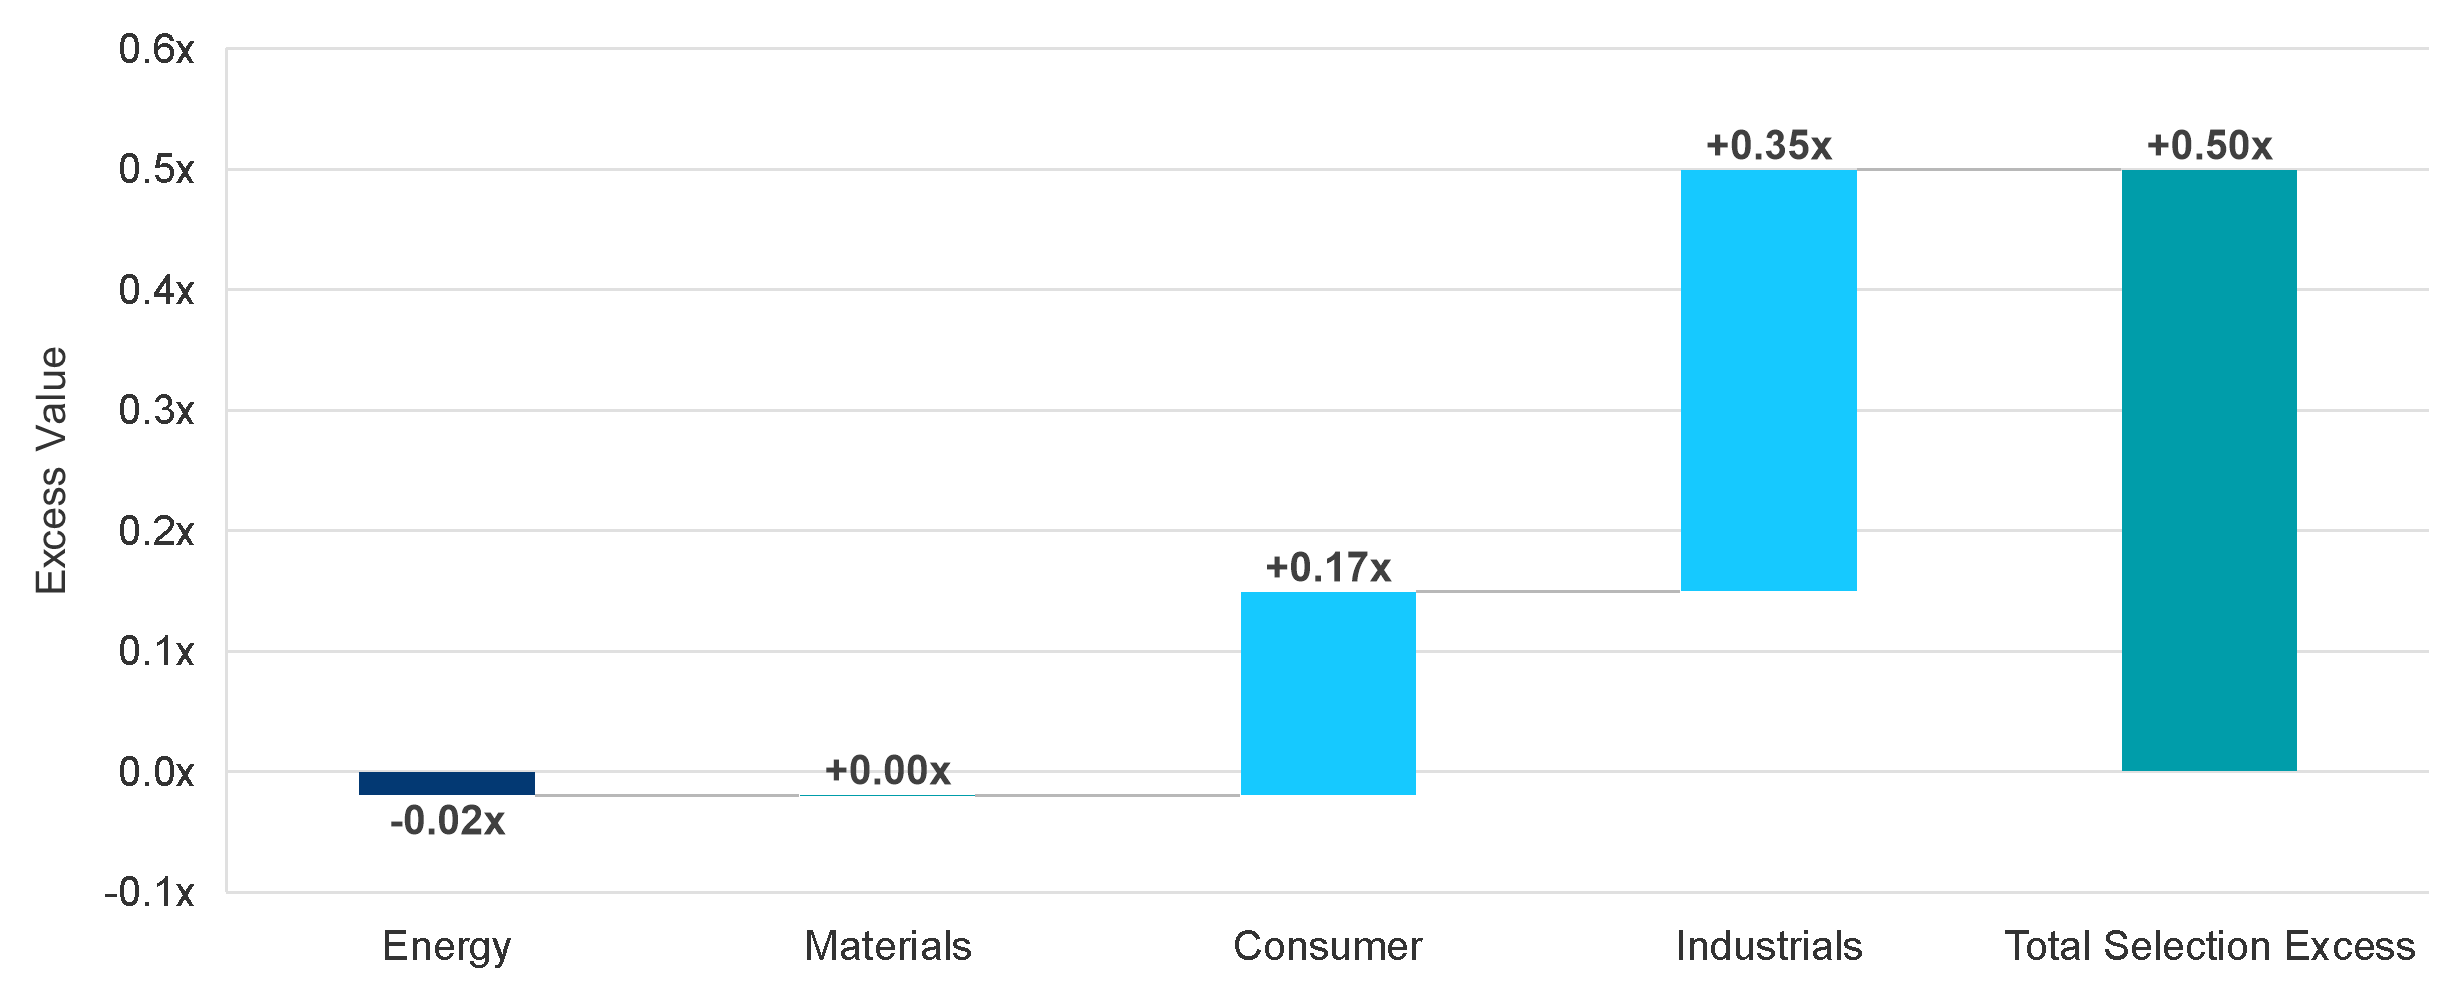
Despite tech-related deal-making accounting for almost a quarter of all buyout deal activity in the 2010s,7 there were productive deals being made in other sectors — sectors that were commonly overlooked. Below is an example of a sector specialist GP with a focus on industrials that had generated a respectable but not top-tier gross TV/TC of 2.8x and a relatively small amount of excess value of 0.3x. However, the decomposition of that excess value showed that a negative sector allocation effect was hiding strong deal selection capabilities within industrials and consumer sectors.  

Track record performance

Excess value attribution

Sector breakdown: selection excess

Source: HarbourVest

We believe in building diversified portfolios and diversifying across sectors — and one of the ways to achieve this is to look for sector specialists who can generate selection alpha as opposed to trying to time your sector investing.  

The key benefits of identifying manager alpha using advanced analytical tools

Looking ahead, this approach to quantifying GP Alpha will be helpful in providing insight into a set of questions that have been previously unanswerable with traditional benchmark data and analysis. For instance, we can look at deal-level alpha generation to gain a better sense of the risk profile, consistency, and sustainability of a GP’s excess returns, and whether this pattern aligns with the GP’s strategy in their next fund.

This deeper level of analysis will no doubt prove useful to investors and, together, would help to do things like corroborate a GP’s articulation of their sweet spot, identify proven sector allocation skills to pivot portfolio exposures in a timely manner, conduct cohort comparisons, and quantify track record quality. It will also help investors to:

  • Examine excess value for core strategy versus extensions, enabling them to identify if there is any decay in the returns
  • Determine if there is a core geographic strength of a given manager, beyond which returns begin to decline
  • Identify if there is a strong or weak investment decision maker on a team
  • Correlate excess returns to fund sizes and deal sizes
  • And identify whether a manager has particular skills in subsectors, etc.

With insights like these now possible, one wonders: what other persistently elusive questions might investors soon be able to answer?

Imagining what is possible in private markets investing

This method of quantifying GP Alpha naturally lends itself to exploring other, related topics amongst investors — topics into which we don’t yet have full metrics but into which future innovations will likely prove useful in driving next level insights.

If you think about what’s happened in public markets with attribution analysis and risk factors, these models will likely soon lend themselves to future innovations to find hidden relationships that may inform views on manager skill. Beyond adapting to innovations, additional data points like operating metrics (e.g., leverage, profits, etc.) will also be useful in this context.

We believe that the ability to separate skill from luck and to predict the persistence of a manager’s performance represents an important complement to existing assessments and can help fill a missing piece of the private markets puzzle. Robust GP Alpha analysis can have a wide range of use cases including making primary investments, evaluating opportunities for concentrated secondary deals, and underwriting direct co-investments. Already at HarbourVest we are applying relevant insights to these kinds of investments and processes, based on our in-house data built over decades. When coupled with an existing rigorous diligence process, these kinds of insights can yield improved investment decision making and a substantive competitive advantage.

Looking ahead, we see a day where attribution analysis will be as common in private markets as it is public markets, and advanced analytical tools will be deployed in meaningful ways to separate skill from luck and boost investor confidence. If you’re interested in learning more, please contact our QIS team.

Contact us

Footnotes
  1. “A Framework for Benchmarking Private Investments”, Cambridge Associates, Jill Shaw, 2014 https://www.cambridgeassociates.com/insight/a-framework-for-benchmarking/
  2. “Enhancing Private Equity Manager Selection with Deeper Data”, Cameron Nicol, eVestment, 2018 
  3. “Performance Attribution: History and Progress”, Carl Bacon, CIPM, CFA Institute Research Foundation, 2019
  4. As of October 8, 2024. Source: HarbourVest investment, monitoring, and due diligence activities. Not representative of any HarbourVest fund, account, and not representative of any HarbourVest experience.
  5. Left hand chart as of June 30, 2024. Right hand chart as of September 30, 2022. Source: HarbourVest investment, monitoring, and due diligence activities. Not representative of any HarbourVest fund, account, and is not representative of any HarbourVest investment experience. Gross of management fees and carried interest.
  6. As of June 30, 2024. Source: Source: HarbourVest investment, monitoring, and due diligence activities. Not representative of any HarbourVest fund, account, and not representative of any HarbourVest experience. Gross of management fees and carried interest
  7. As of June 30, 2024. Source: Source: HarbourVest investment, monitoring, and due diligence activities. Not representative of any HarbourVest fund, account, and not representative of any HarbourVest experience. Gross of management fees and carried interest.
Disclosure

HarbourVest Partners, LLC is a registered investment adviser under the Investment Advisers Act of 1940. This material is solely for informational purposes and should not be viewed as a current or past recommendation or an offer to sell or the solicitation to buy securities or adopt any investment strategy.  The opinions expressed herein represent the current, good faith views of the author(s) at the time of publication, are not definitive investment advice, and should not be relied upon as such. This material has been developed internally and/or obtained from sources believed to be reliable; however, HarbourVest does not guarantee the accuracy, adequacy or completeness of such information. There is no assurance that any events or projections will occur, and outcomes may be significantly different than the opinions shown here.  This information, including any projections concerning financial market performance, is based on current market conditions, which will fluctuate and may be superseded by subsequent market events or for other reasons. The information contained herein must be kept strictly confidential and may not be reproduced or redistributed in any format without the express written approval of HarbourVest.

Nothing herein should be construed as a solicitation, offer, recommendation, representation of suitability, legal advice, tax advice, or endorsement of any security or investment and should not be relied upon by you in evaluating the merits of investing in HarbourVest funds or in any other investment decision.

Market analysis is not representative of any HarbourVest product. This presentation quantitative analysis of the global private equity industry derived from HarbourVest’s proprietary Quant Database. The proprietary Quant Database is a compilation of private equity partnership and transactional data drawn from internal and external sources. The proprietary Quant Database has been developed internally based on information obtained from sources believed to be reliable; however, HarbourVest does not guarantee the accuracy, or completeness of such information. This proprietary database is intended to be representative of the broader private equity market and does not reflect the investment performance of any HarbourVest investment or the experience of any investor in any HarbourVest fund.

Professional Investor Definition

“Professional Investor” under the Securities and Futures Ordinance (Cap. 571 of the Laws of Hong Kong) (the “SFO”) and its subsidiary legislation) means:

(a) any recognised exchange company, recognised clearing house, recognised exchange controller or recognised investor compensation company, or any person authorised to provide automated trading services under section 95(2) of the SFO;

(b) any intermediary, or any other person carrying on the business of the provision of investment services and regulated under the law of any place outside Hong Kong;

(c) any authorized financial institution, or any bank which is not an authorised financial institution but is regulated under the law of any place outside Hong Kong;

(d) any insurer authorized under the Insurance Ordinance (Cap. 41 of the Laws of Hong Kong), or any other person carrying on insurance business and regulated under the law of any place outside Hong Kong;

(e) any scheme which-

(i) is a collective investment scheme authorised under section 104 of the SFO; or

(ii) is similarly constituted under the law of any place outside Hong Kong and, if it is regulated under the law of such place, is permitted to be operated under the law of such place,

or any person by whom any such scheme is operated;

(f) any registered scheme as defined in section 2(1) of the Mandatory Provident Fund Schemes Ordinance (Cap. 485 of the Laws of Hong Kong), or its constituent fund as defined in section 2 of the Mandatory Provident Fund Schemes (General) Regulation (Cap. 485A of the Laws of Hong Kong), or any person who, in relation to any such registered scheme, is an approved trustee or service provider as defined in section 2(1) of that Ordinance or who is an investment manager of any such registered scheme or constituent fund;

(g) any scheme which-

(i) is a registered scheme as defined in section 2(1) of the Occupational Retirement Schemes Ordinance (Cap. 426 of the Laws of Hong Kong); or

(ii) is an offshore scheme as defined in section 2(1) of that Ordinance and, if it is regulated under the law of the place in which it is domiciled, is permitted to be operated under the law of such place,

or any person who, in relation to any such scheme, is an administrator as defined in section 2(1) of that Ordinance;

(h) any government (other than a municipal government authority), any institution which performs the functions of a central bank, or any multilateral agency;

(i) except for the purposes of Schedule 5 to the SFO, any corporation which is-

(i) a wholly owned subsidiary of-

(A) an intermediary, or any other person carrying on the business of the provision of investment services and regulated under the law of any place outside Hong Kong; or

(B) an authorized financial institution, or any bank which is not an authorised financial institution but is regulated under the law of any place outside Hong Kong;

(ii) a holding company which holds all the issued share capital of-

(A) an intermediary, or any other person carrying on the business of the provision of investment services and regulated under the law of any place outside Hong Kong; or

(B) an authorized financial institution, or any bank which is not an authorised financial institution but is regulated under the law of any place outside Hong Kong; or

(iii) any other wholly owned subsidiary of a holding company referred to in subparagraph (ii); or

(j) any person of a class which is prescribed by rules made under section 397 of the SFO for the purposes of this paragraph as within the meaning of this definition for the purposes of the provisions of the SFO, or to the extent that it is prescribed by rules so made as within the meaning of this definition for the purposes of any provision of the SFO.

The first of such classes of additional “professional investor”, under the Securities and Futures (Professional Investor) Rules (Cap. 571D of the Laws of Hong Kong), are:

(k) any trust corporation (registered under Part VIII of the Trustee Ordinance (Cap. 29 of the Laws of Hong Kong) or the equivalent overseas) having been entrusted under the trust or trusts of which it acts as a trustee with total assets of not less than HK$40 million or its equivalent in any foreign currency at the relevant date (see below) or-

(i) as stated in the most recent audited financial statement prepared-

(A) in respect of the trust corporation; and

(B) within 16 months before the relevant date;

(ii) as ascertained by referring to one or more audited financial statements, each being the most recent audited financial statement, prepared-

(A) in respect of the trust or any of the trust; and

(B) within 16 months before the relevant date; or

(iii) as ascertained by referring to one or more custodian (see below) statements issued to the trust corporation-

(A) in respect of the trust or any of the trusts; and

(B) within 12 months before the relevant date;

(l) any individual, either alone or with any of his associates (the spouse or any child) on a joint account, having a portfolio (see below) of not less than HK$8 million or its equivalent in any foreign currency at the relevant date or-

(i) as stated in a certificate issued by an auditor or a certified public accountant of the individual within 12 months before the relevant date; or

(ii)  as ascertained by referring to one or more custodian statements issued to the individual (either alone or with the associate) within 12 months before the relevant date;

(m) any corporation or partnership having-

(i) a portfolio of not less than HK$8 million or its equivalent in any foreign currency; or

(ii) total assets of not less than HK$40 million or its equivalent in any foreign currency, at the relevant date, or as ascertained by referring to-

(iii) the most recent audited financial statement prepared-

(A) in respect of the corporation or partnership (as the case may be); and

(B) within 16 months before the relevant date; or

(iv) one or more custodian statements issued to the corporation or partnership (as the case may be) within 12 months before the relevant date; and

(n) any corporation the sole business of which is to hold investments and which at the relevant date is wholly owned by any one or more of the following persons-

(i) a trust corporation that falls within the description in paragraph (k);

(ii) an individual who, either alone or with any of his or her associates on a joint account, falls within the description in paragraph (k);

(iii) a corporation that falls within the description in paragraph (m);

(iv) a partnership that falls within the description in paragraph (m).

For the purposes of paragraphs (k) to (n) above:

  • “relevant date” means the date on which the advertisement, invitation or document (made in respect of securities or structured products or interests in any collective investment scheme, which is intended to be disposed of only to professional investors), is issued, or possessed for the purposes of issue;
  • “custodian” means (i) a corporation whose principal business is to act as a securities custodian, or (ii) an authorised financial institution under the Banking Ordinance (Cap. 155 of the Laws of Hong Kong); an overseas bank; a corporation licensed under the SFO; or an overseas financial intermediary, whose business includes acting as a custodian; and
  • “portfolio” means a portfolio comprising any of the following (i) securities; (ii) certificates of deposit issued by an authorised financial institution under the Banking Ordinance (Cap, 155 of the Laws of Hong Kong) or an overseas bank; and (iii) except for trust corporations, cash held by a custodian.

Institutional Investor / Accredited Investor Definition

An institutional investor as defined in Section 4A of the SFA and Securities and Futures (Classes of Investors) Regulations 2018 is:

(a) the Singapore Government;

(b) a statutory board as may be prescribed by regulations made under section 341 of the SFA, as prescribed in the Second Schedule of the Securities and Futures (Classes of Investors) Regulations 2018;

(c) an entity that is wholly and beneficially owned, whether directly or indirectly, by a central government of a country and whose principal activity is —

(i) to manage its own funds;

(ii) to manage the funds of the central government of that country (which may include the reserves of that central government and any pension or provident fund of that country); or

(iii) to manage the funds (which may include the reserves of that central government and any pension or provident fund of that country) of another entity that is wholly and beneficially owned, whether directly or indirectly, by the central government of that country;

(d) any entity —

(i) that is wholly and beneficially owned, whether directly or indirectly, by the central government of a country; and

(ii) whose funds are managed by an entity mentioned in sub‑paragraph (c);

(e) a bank that is licensed under the Banking Act 1970;

(f) a merchant bank that is licensed under the Banking Act 1970;

(g) a finance company that is licensed under the Finance Companies Act 1967;

(h) a company or co‑operative society that is licensed under the Insurance Act 1966 to carry on insurance business in Singapore;

(i) a company licensed under the Trust Companies Act 2005;

(j) a holder of a capital markets services licence;

(k) an approved exchange;

(l) a recognised market operator;

(m) an approved clearing house;

(n) a recognised clearing house;

(o) a licensed trade repository;

(p) a licensed foreign trade repository;

(q) an approved holding company;

(r) a Depository as defined in section 81SF of the SFA;

(s) a pension fund, or collective investment scheme, whether constituted in Singapore or elsewhere;

(t) a person (other than an individual) who carries on the business of dealing in bonds with accredited investors or expert investors;

(u) a designated market‑maker as defined in paragraph 1 of the Second Schedule to the Securities and Futures (Licensing and Conduct of Business) Regulations;

(v) a headquarters company or Finance and Treasury Centre which carries on a class of business involving fund management, where such business has been approved as a qualifying service in relation to that headquarters company or Finance and Treasury Centre under section 43D(2)(a) or 43E(2)(a) of the Income Tax Act 1947;

(w) a person who undertakes fund management activity (whether in Singapore or elsewhere) on behalf of not more than 30 qualified investors;

(x) a Service Company (as defined in regulation 2 of the Insurance (Lloyd’s Asia Scheme) Regulations) which carries on business as an agent of a member of Lloyd’s;

(y) a corporation the entire share capital of which is owned by an institutional investor or by persons all of whom are institutional investors;

(z) a partnership (other than a limited liability partnership within the meaning of the Limited Liability Partnerships Act 2005) in which each partner is an institutional investor.

An accredited investor as defined in Section 4A of the SFA and Securities and Futures (Classes of Investors) Regulations 2018 is:

(i)  an individual —

(A) whose net personal assets exceed in value $2 million (or its equivalent in a foreign currency) or such other amount as the Authority may prescribe in place of the first amount;

(B) whose financial assets (net of any related liabilities) exceed in value $1 million (or its equivalent in a foreign currency) or such other amount as the Authority may prescribe in place of the first amount, where “financial asset” means —

(BA) a deposit as defined in section 4B of the Banking Act 1970;

(BB) an investment product as defined in section 2(1) of the Financial Advisers Act 2001; or

(BC) any other asset as may be prescribed by regulations made under section 341; or

(C) whose income in the preceding 12 months is not less than $300,000 (or its equivalent in a foreign currency) or such other amount as the Authority may prescribe in place of the first amount;

(ii)  a corporation with net assets exceeding $10 million in value (or its equivalent in a foreign currency) or such other amount as the Authority may prescribe, in place of the first amount, as determined by —

(A) the most recent audited balance sheet of the corporation; or

(B) where the corporation is not required to prepare audited accounts regularly, a balance sheet of the corporation certified by the corporation as giving a true and fair view of the state of affairs of the corporation as of the date of the balance sheet, which date must be within the preceding 12 months;

(iii) A trustee of a trust which all the beneficiaries are accredited investors; or

(iv) A trustee of a trust which the subject matter exceeds S$10 million; or

(v) An entity (other than a corporation) with net assets exceeding S$10 million (or its equivalent in a foreign currency) in value. “Entity” includes an unincorporated association, a partnership and the government of any state, but does not include a trust; or

(vi) A partnership (other than a limited liability partnership) in which every partner is an accredited investor; or

(vii) A corporation which the entire share capital is owned by one or more persons, all of whom are accredited investors.

Continuation solutions encompass a host of transaction types in which a GP secures interim liquidity and/or additional primary capital for their LPs in a strongly performing asset, or set of assets, that the GP will continue to own and control. Specifically, they include continuation funds, new funds created by GPs for the purpose of acquiring the asset(s) that continue to be managed by the same GP and capitalized by one or several secondary buyers, or equity recapitalizations involving a direct equity or structured equity investment into a portfolio company. These transactions can also include a parallel investment from the GP’s latest fund into that same pool of assets (a “cross-fund trade”).